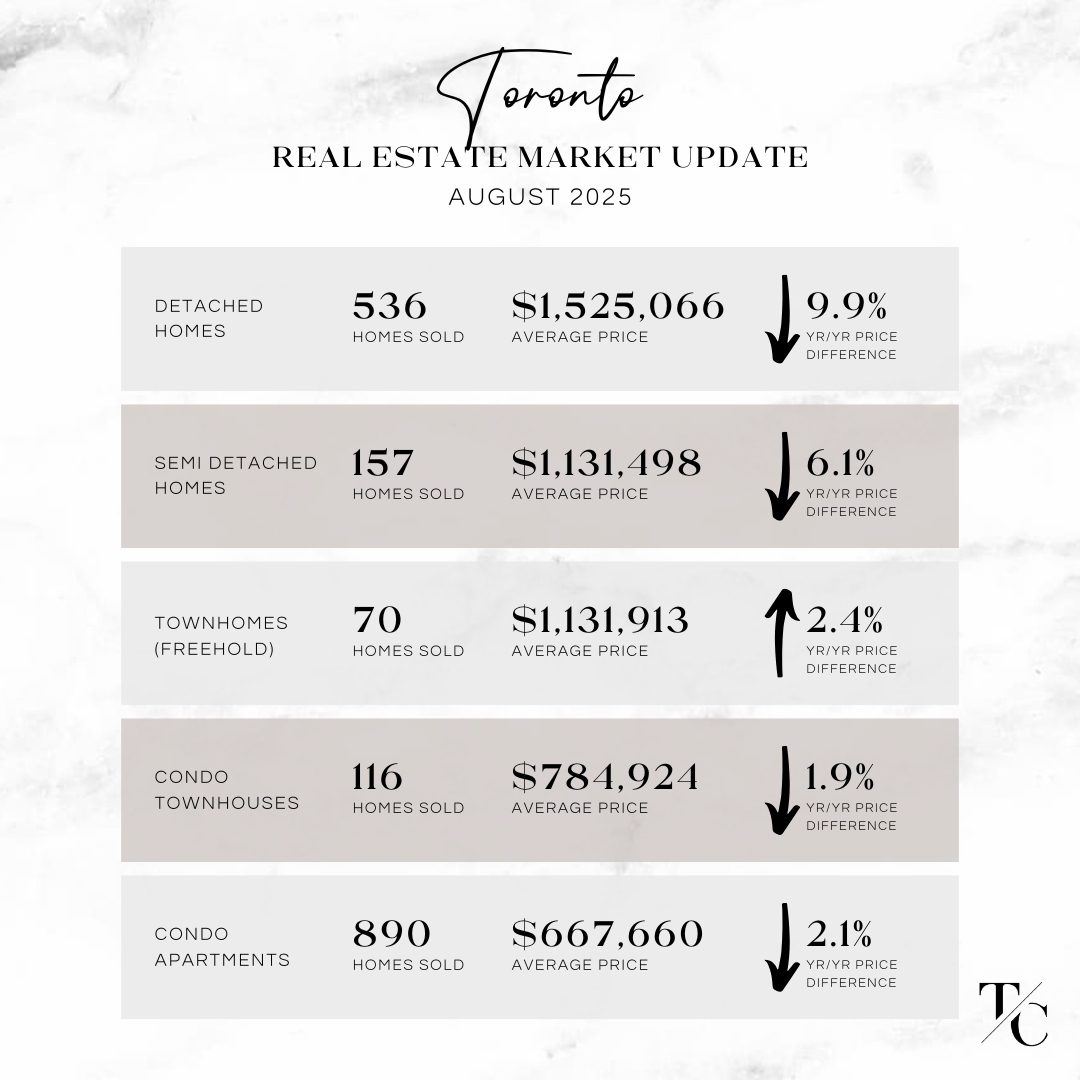
📣 𝐍𝐄𝐖𝐒𝐅𝐋𝐀𝐒𝐇! Here are the real estate market stats you need to know for August 2025 vs. 2024 home sales in Toronto, Mississauga, Oakville, Burlington.
Home sales were up slightly compared to 2024 according to Toronto Regional Real Estate Board stats, although the pace of transactions lagged well behind supply — with four times more new listings than sales. From July to August 2025, fewer homes sold across nearly every property type, reflecting the seasonal slowdown that typically comes with August. Overall, prices held steady compared to the month prior, while year-over-year values remain lower across all the areas in our report. Among all home types, detached homes continue to show the most resilience.
𝗛𝗲𝗿𝗲 𝗮𝗿𝗲 𝗼𝘂𝗿 𝗸𝗲𝘆 𝘁𝗮𝗸𝗲𝗮𝘄𝗮𝘆𝘀 𝗼𝗻 𝘁𝗵𝗲 𝗺𝗼𝗻𝘁𝗵 𝗼𝘃𝗲𝗿 𝗺𝗼𝗻𝘁𝗵 𝗮𝗰𝘁𝗶𝘃𝗶𝘁𝘆 𝗯𝗲𝘁𝘄𝗲𝗲𝗻 𝗝𝘂𝗹𝘆 𝗮𝗻𝗱 𝗔𝘂𝗴𝘂𝘀𝘁 𝟮𝟬𝟮𝟱:
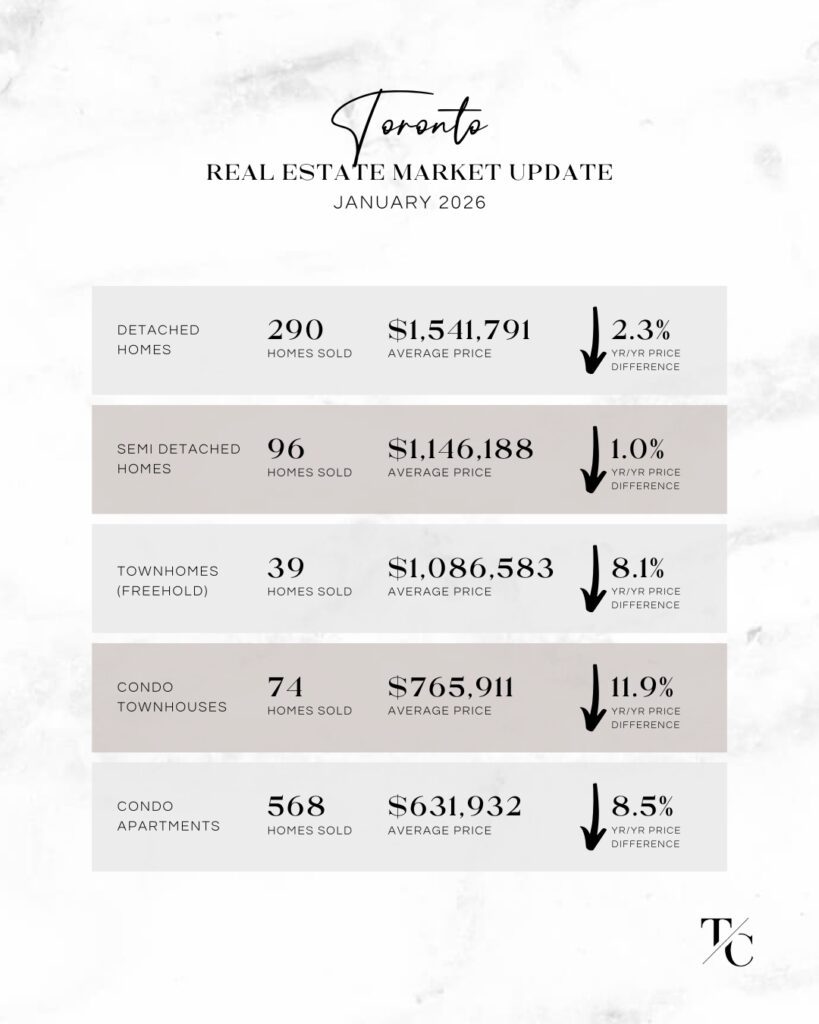
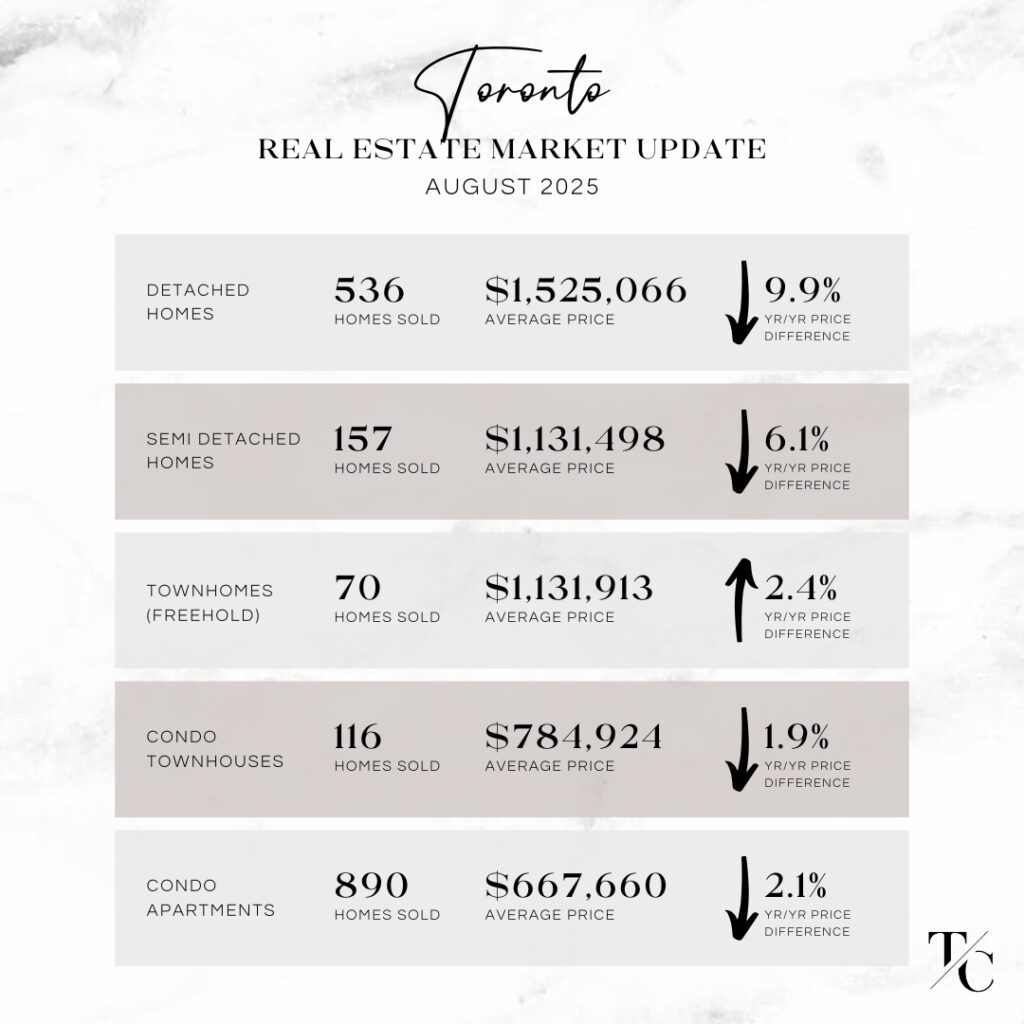
◼️ Toronto’s average detached home values fell nearly 10% year over year with a slight month-over-month dip, semi-detached values dropped $90K from last month and with almost 100 fewer sales. Freehold townhomes were the only category up year over year yet flat month to month (though notably down 11% year over year and $100K month over month), condo townhomes dipped slightly, and condo apartments remained flat with 138 fewer units sold.
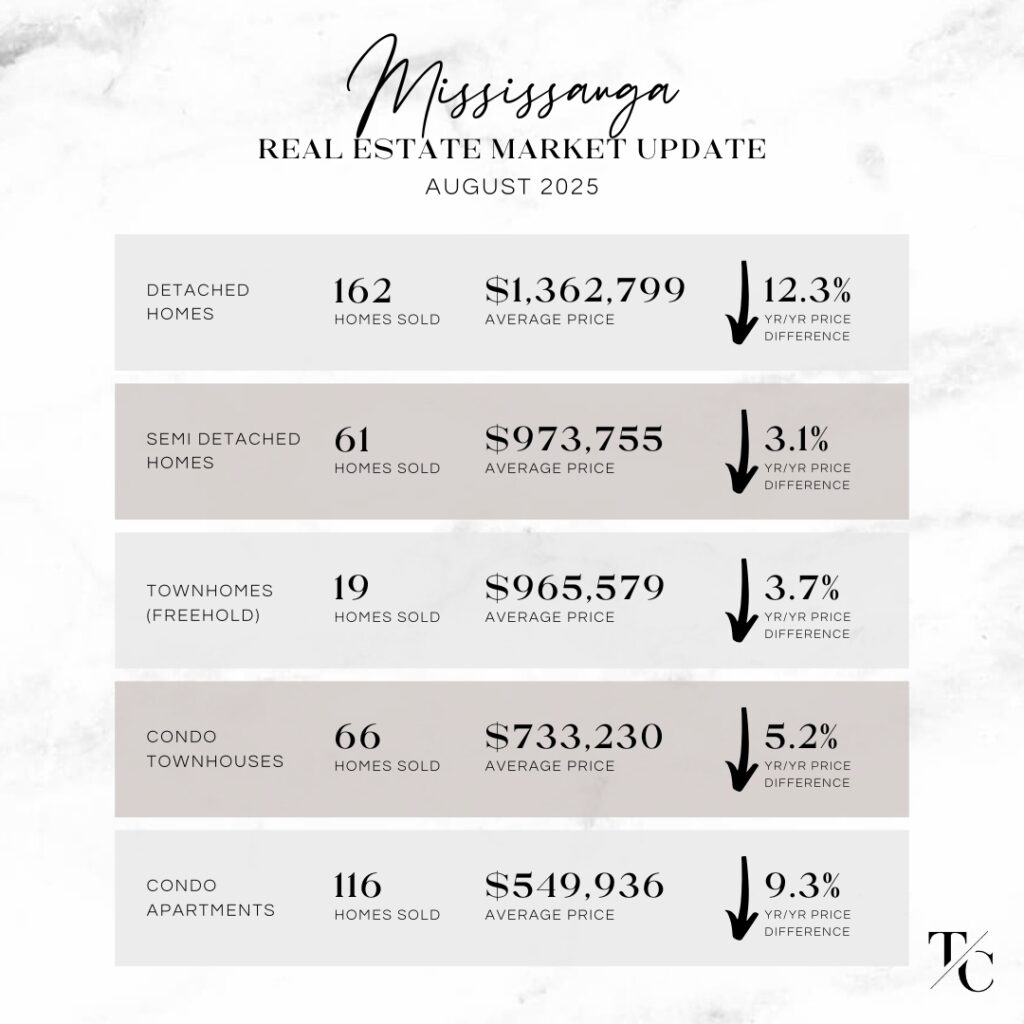
◼️ Mississauga’s average detached home values fell 6.7% year over year and $120,000 month over month, while semi-detached homes, condo townhomes, and condo apartments held steady; sales volumes declined across all housing types except freehold townhomes, which remained consistent.
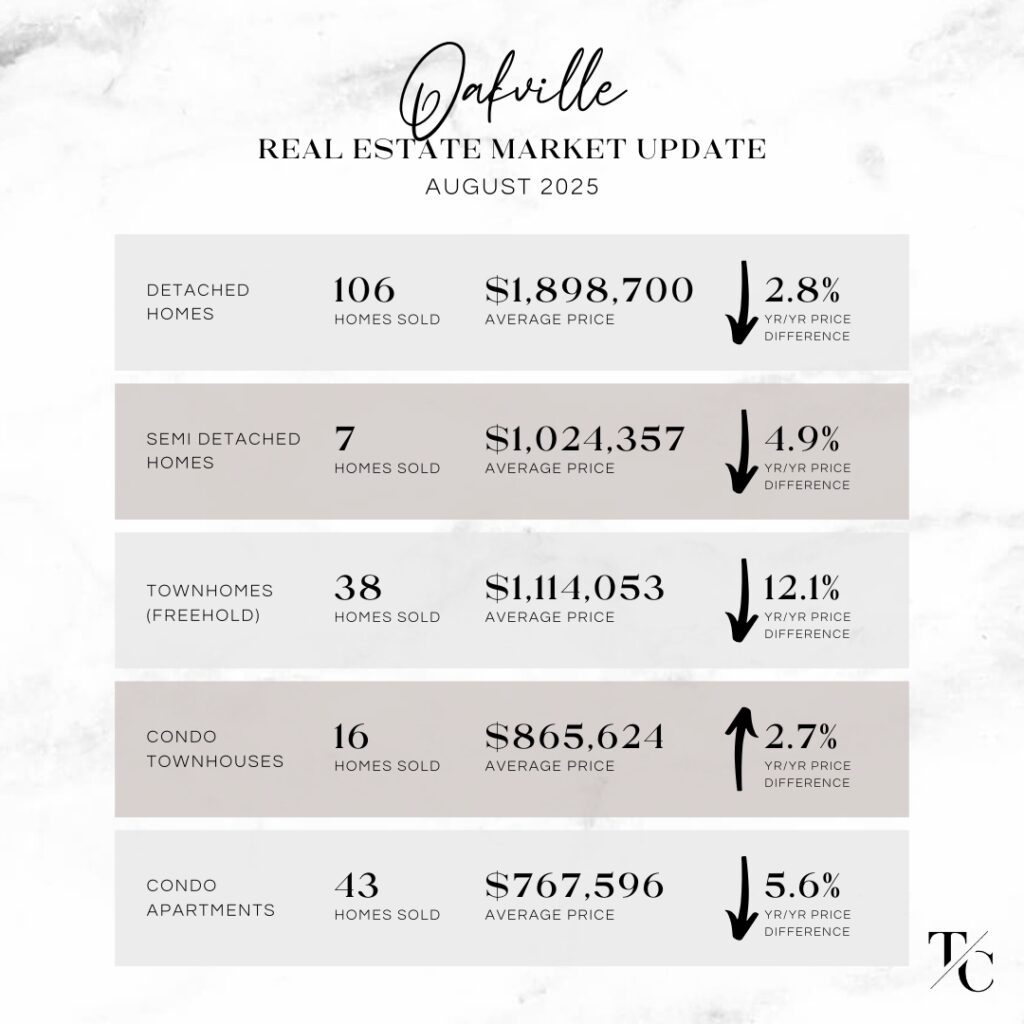
◼️ Oakville’s average detached home values saw the smallest year-over-year decline at 2.8%, though down $100,000 month over month; semi-detached values held steady, while freehold townhomes, condo townhomes, and condo apartments saw month-over-month gains on the average price and with overall sales volumes steady across all home types except detached, which had 14 fewer sales.
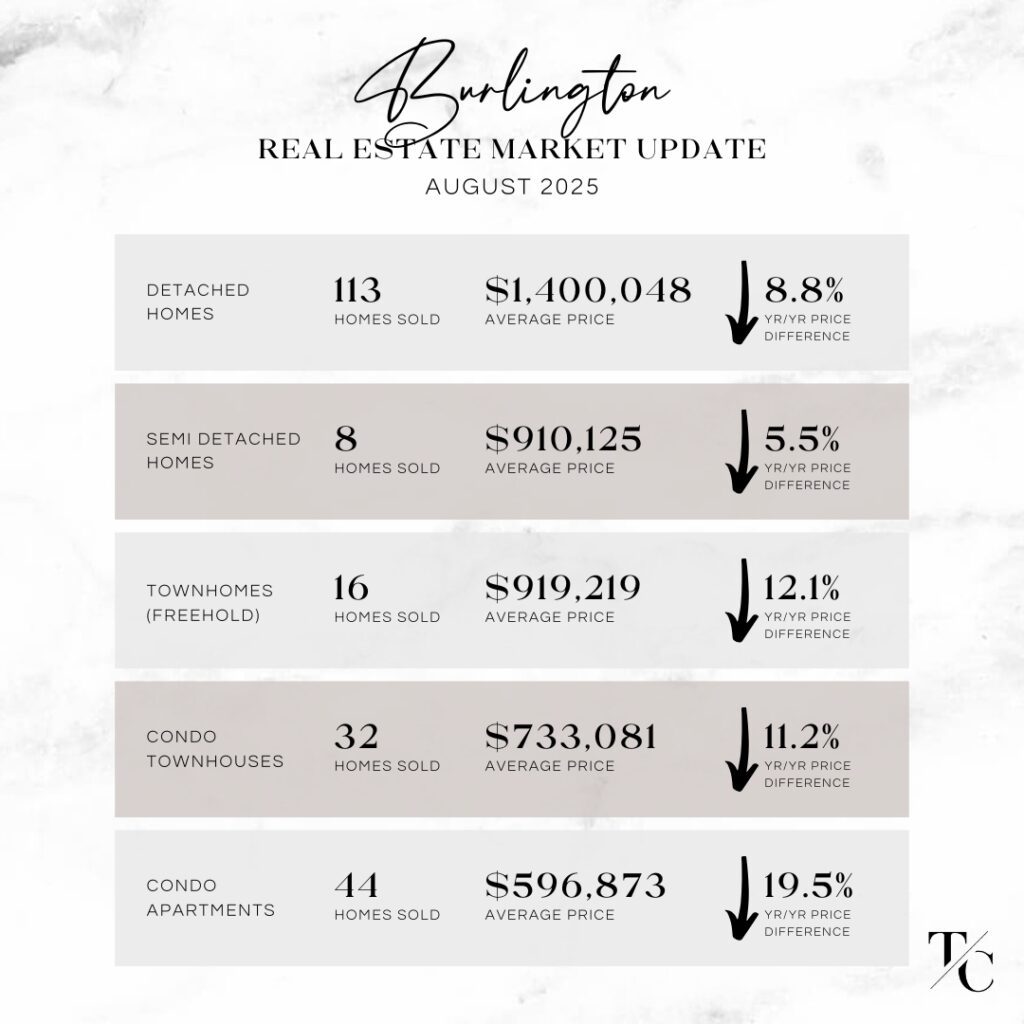
◼️ Burlington detached home values held steady month over month yet were down 8.8% year over year. All remaining home types were flat month over month but saw double-digit annual declines, including freehold townhomes, condo townhomes, and condo apartments. Condo apartments were down a striking 19.5% year over year — the largest decline by category across the areas in our report.
𝘞𝘢𝘯𝘵 𝘵𝘰 𝘬𝘯𝘰𝘸 𝘸𝘩𝘢𝘵’𝘴 𝘩𝘢𝘱𝘱𝘦𝘯𝘪𝘯𝘨 𝘪𝘯 𝘺𝘰𝘶𝘳 𝘯𝘦𝘪𝘨𝘩𝘣𝘰𝘶𝘳𝘩𝘰𝘰𝘥? Obtain a personalized market analysis by booking a complimentary Buyer or Seller consultation with us via the form below.
Get in touch
Fill out a few details and we will reach out to you