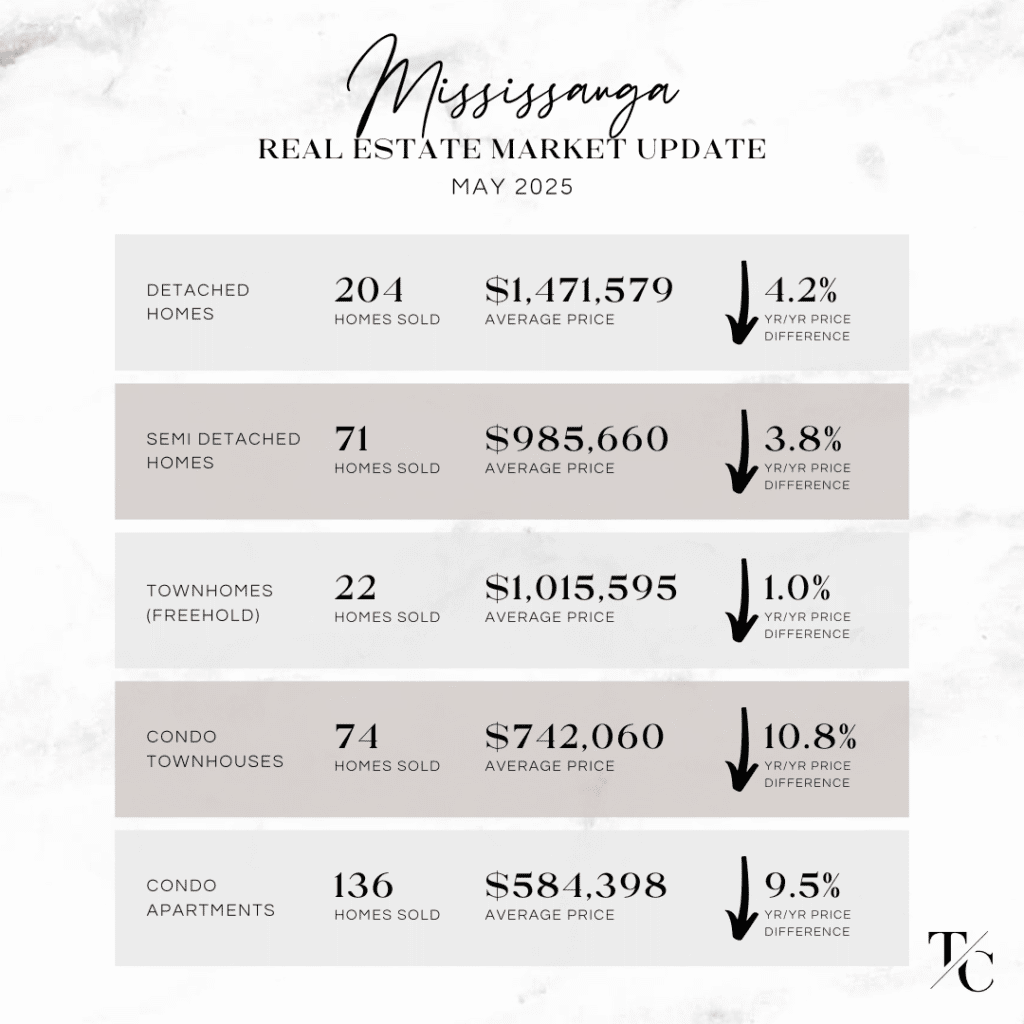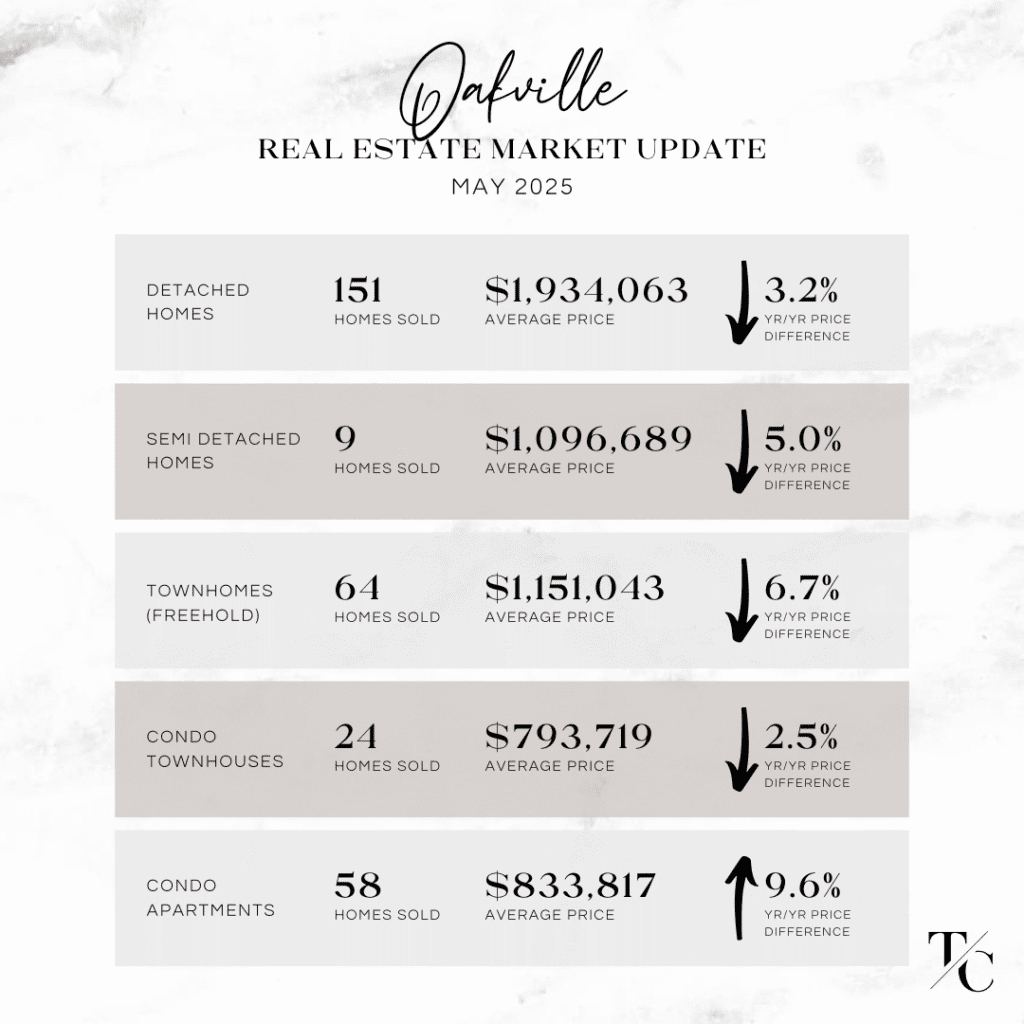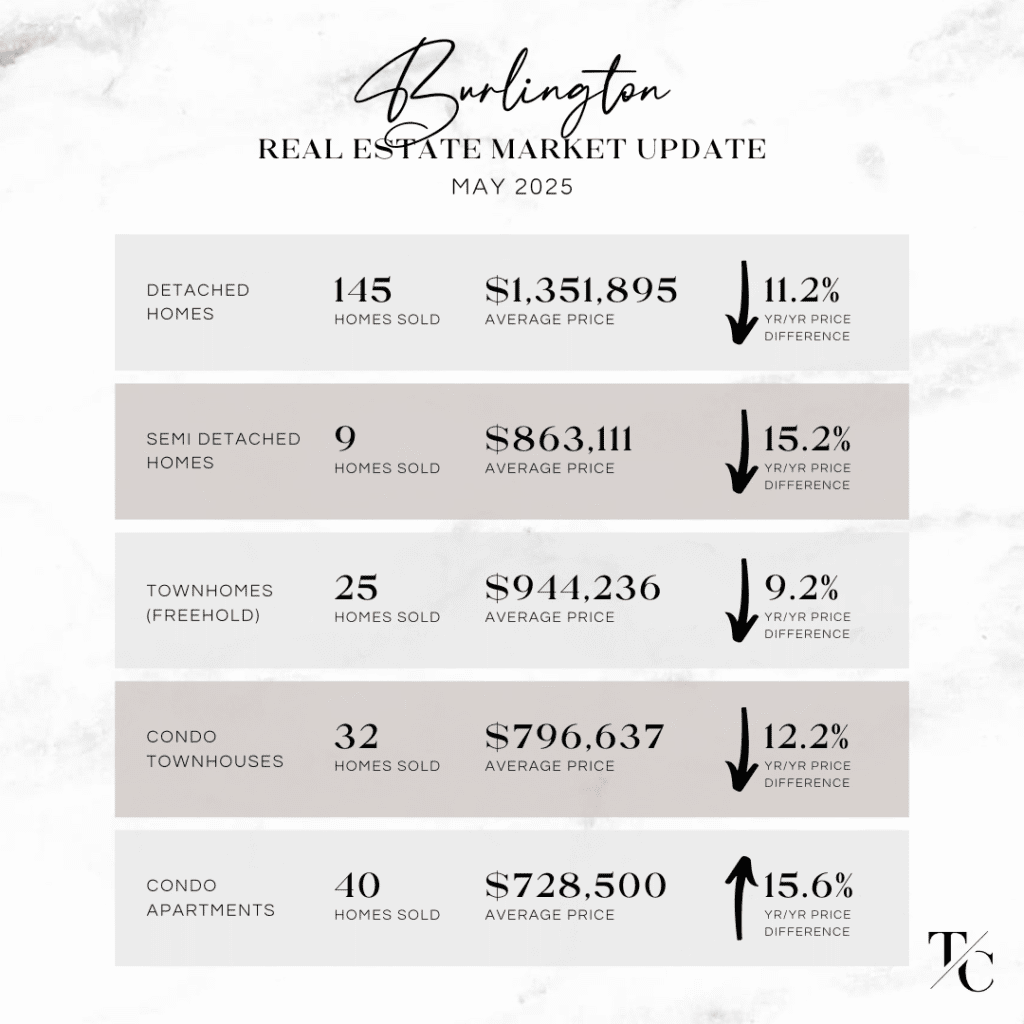
Looking for recent sold data? click here

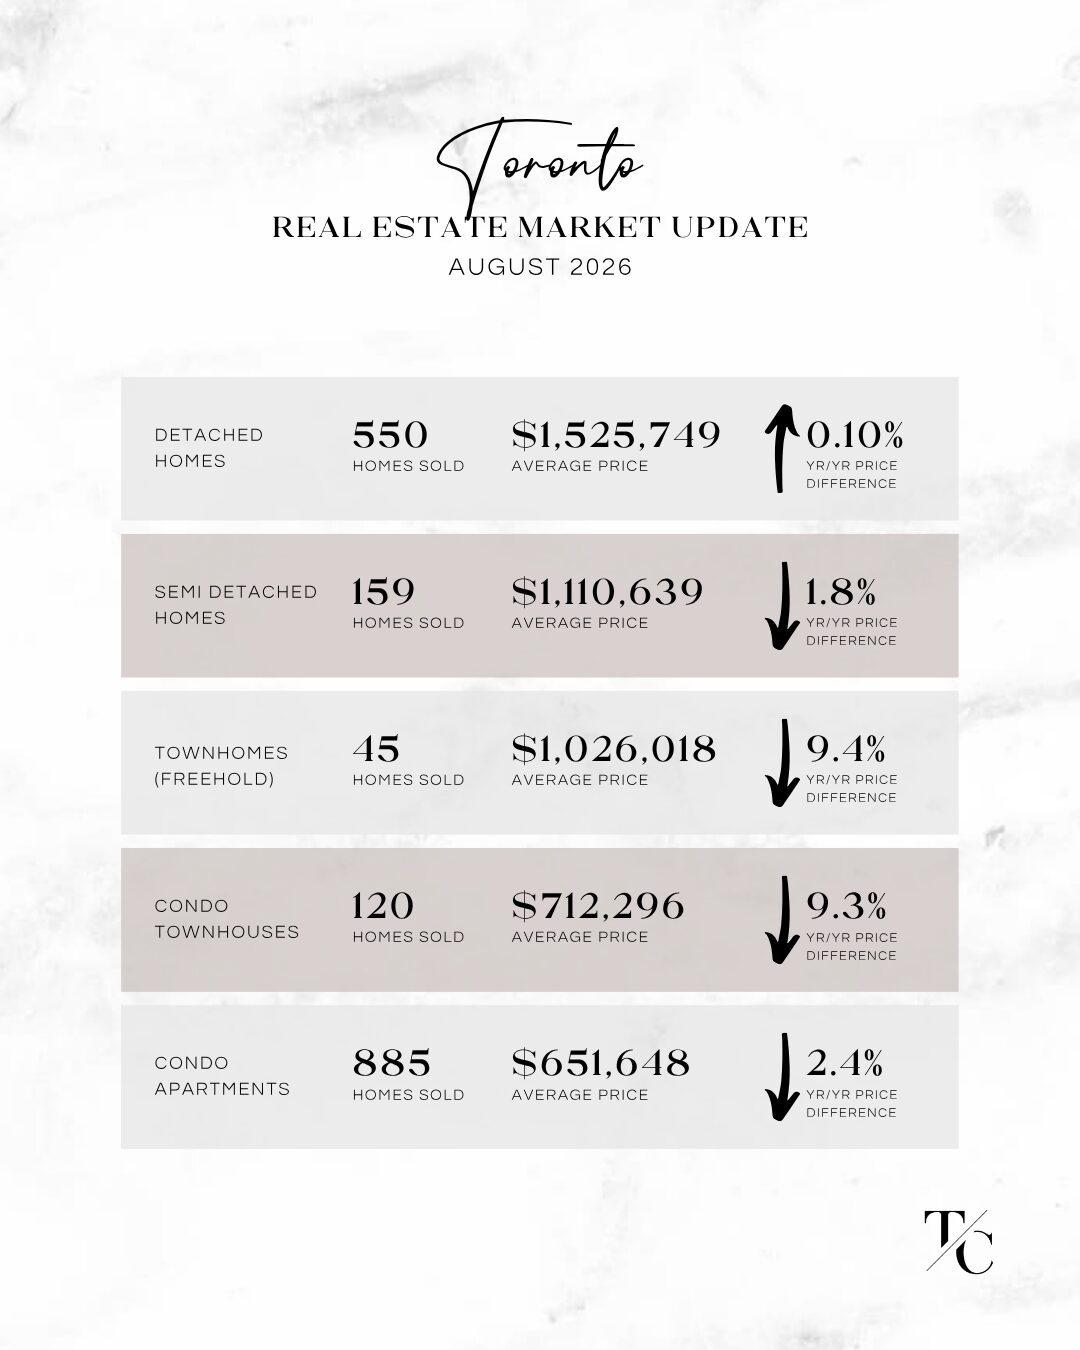
August 2026 Market Stats - Toronto

Toronto & West GTA Real Estate Market Update – August 2026

Sep 17, 2026 | Burlington

📣 𝐍𝐄𝐖𝐒𝐅𝐋𝐀𝐒𝐇! Here are the real estate market stats you need to know for August 2026 home sales in Toronto, Mississauga, Oakville and Burlington.

August brought a noticeable slowdown in sales volume across many of the housing segments we track, while average home prices were more varied depending on location and property type. Several segments remained relatively stable month over month, while others experienced more significant price movement.

On a broader market level, GTA REALTORS® reported 5,057 home sales through TRREB’s MLS® System in August 2026, down 2.1% compared to August 2025. New listings declined more significantly, down 14.1% year over year to 12,075. The average GTA selling price was $993,410, down 2.7% compared to August 2025. On a seasonally adjusted basis, home sales edged slightly lower compared to July, while the average selling price increased slightly month over month.

The decline in new listings is worth watching as we move toward the fall market. While buyer activity moderated in August, fewer new listings coming to market can also reduce choice for buyers. Market conditions continue to vary considerably depending on location and property type, making the most recent local data particularly important when assessing current conditions.

Here are our key takeaways on the month-over-month activity between July 2026 and August 2026:

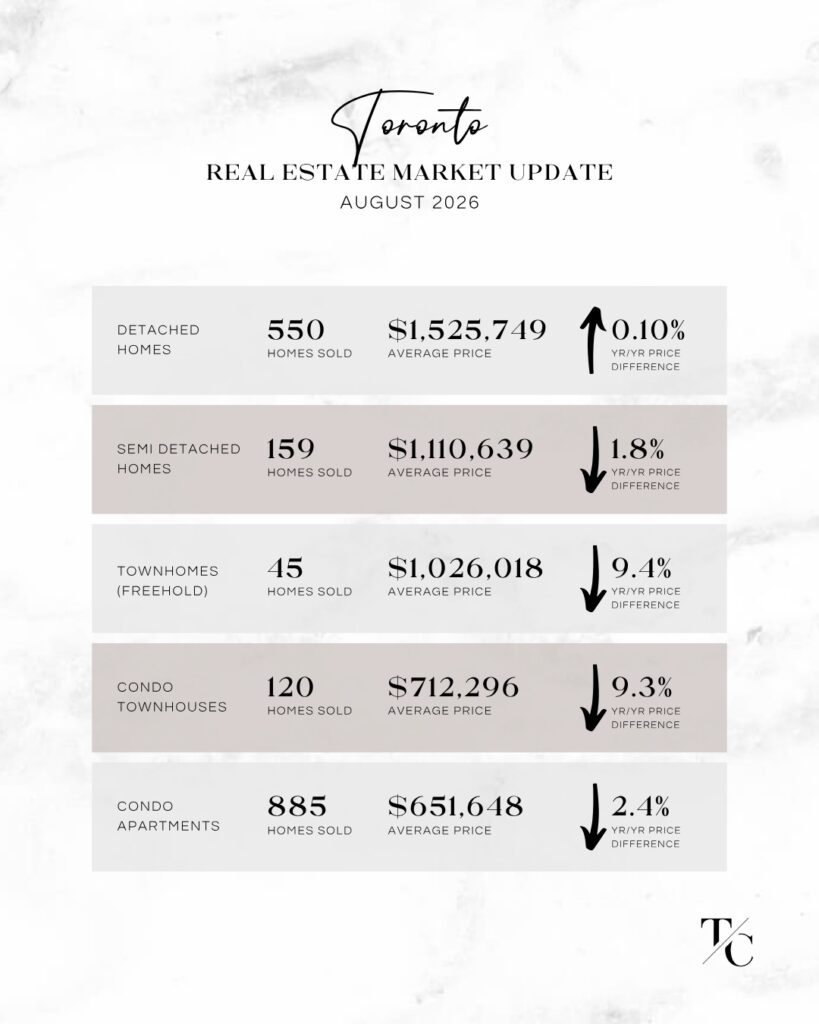
TORONTO REAL ESTATE MARKET – AUGUST 2026

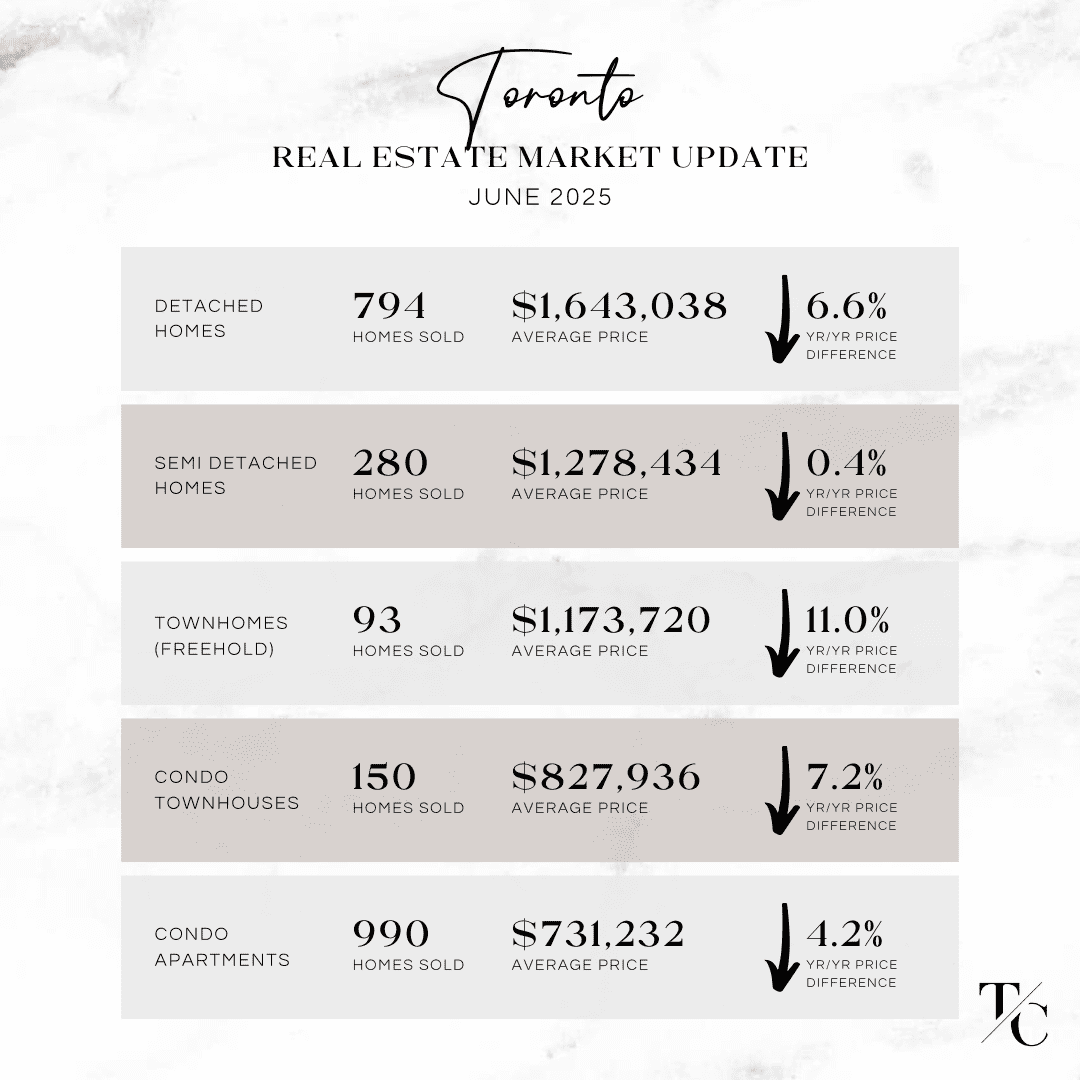
Toronto average home prices were fairly consistent across most housing types in August, with no significant month-over-month price change in the detached, semi-detached or freehold townhouse markets. Where we saw a greater shift was in sales volume (the number of homes sold). Detached home sales volume was down approximately 20% month over month, representing 141 fewer homes sold in August. Condo townhouses saw the largest price decline, with the average price down approximately $45,000 compared to July. Condo apartment prices remained relatively stable, while sales volume was down approximately 16%, representing 169 fewer condo units sold compared to the month prior.

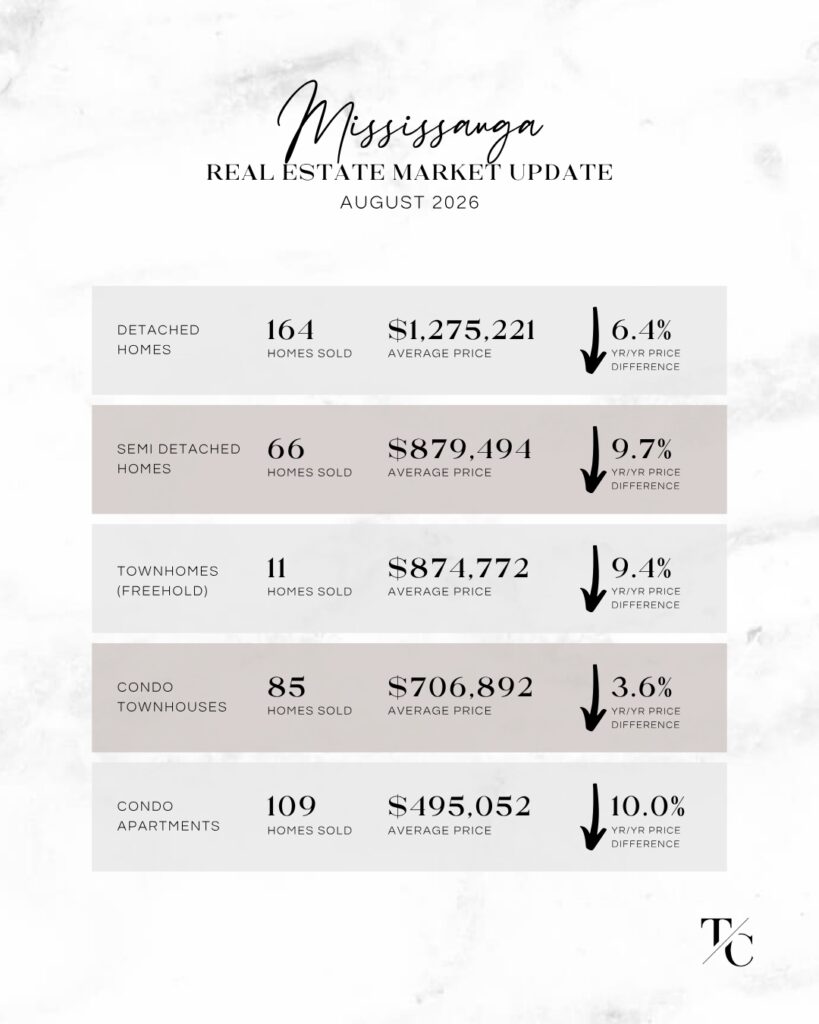
MISSISSAUGA REAL ESTATE MARKET – AUGUST 2026

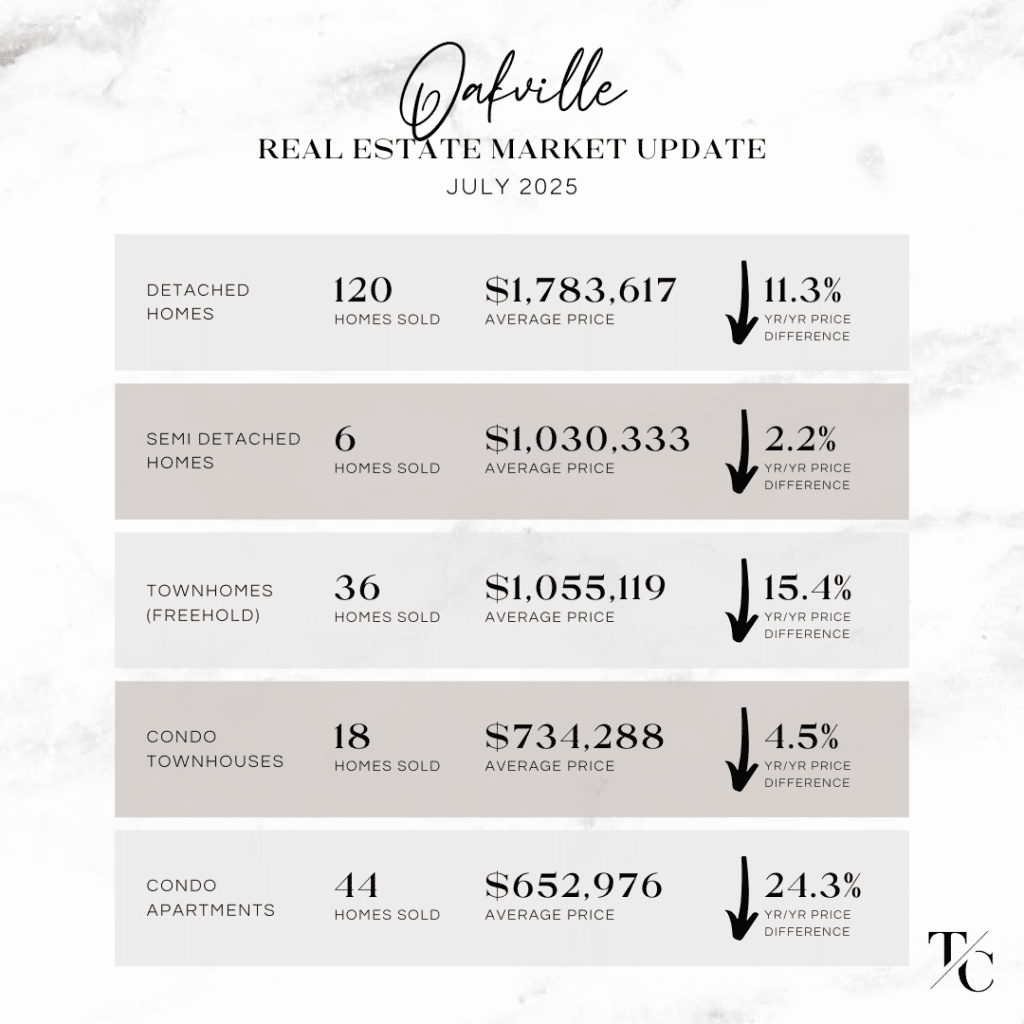
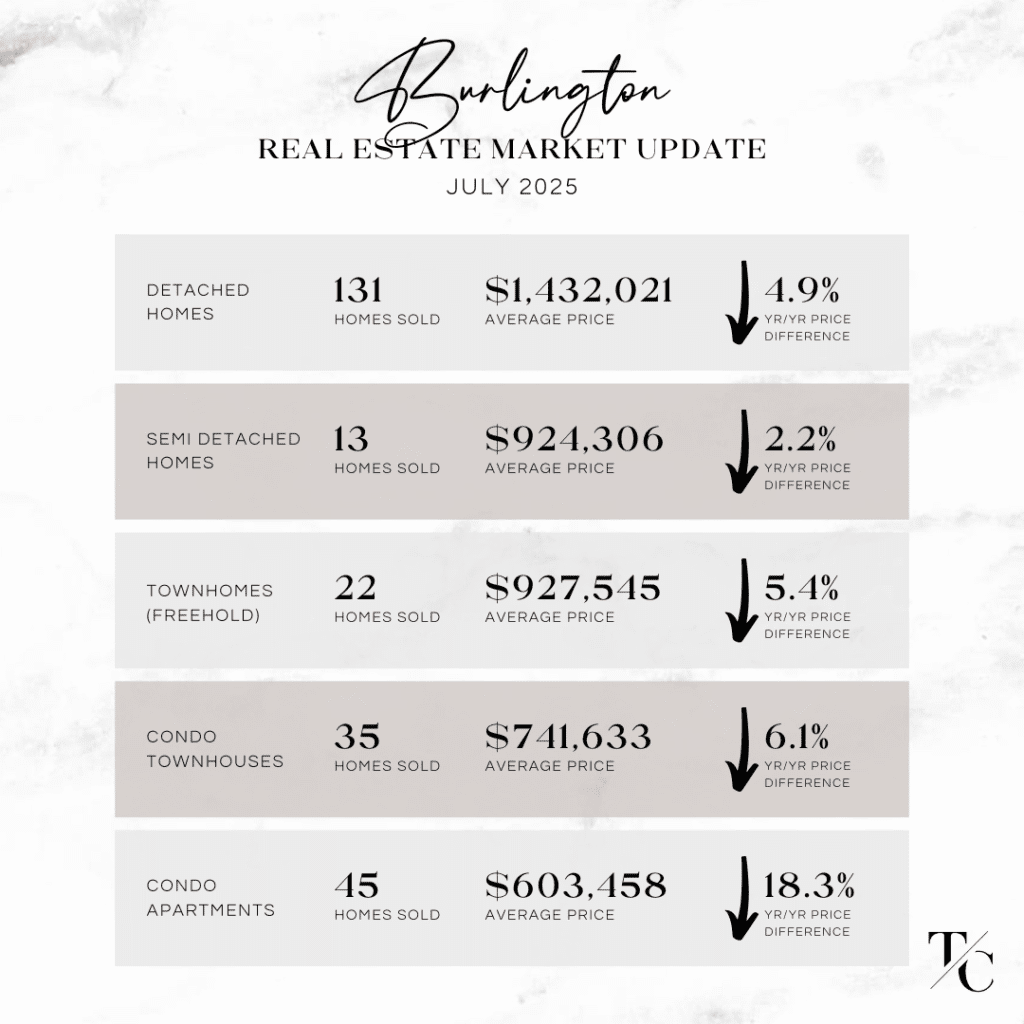
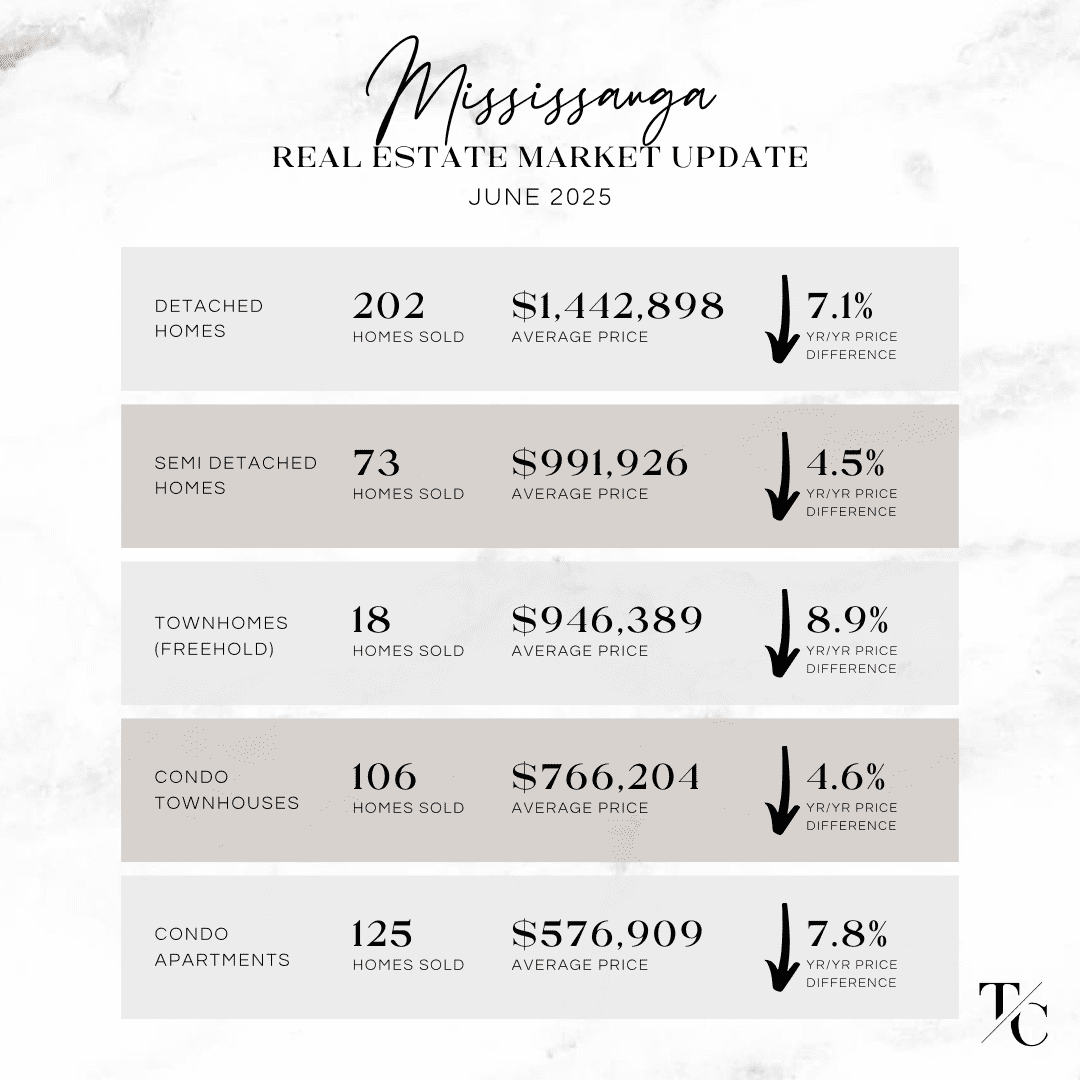
Mississauga home prices were also fairly consistent across most housing types on a month-over-month basis. The average detached home price was essentially flat, while detached sales volume was down approximately 11%. Semi-detached and condo townhouse prices also saw little change from July. Freehold townhouses experienced the largest price decline, with the average price down approximately $37,000 month over month, while sales volume declined by approximately 52%. Condo apartment prices remained relatively stable compared to July. Year over year, the average condo apartment price was down 10%, making this the most significant annual price change among product type in Mississauga.

OAKVILLE REAL ESTATE MARKET – AUGUST 2026

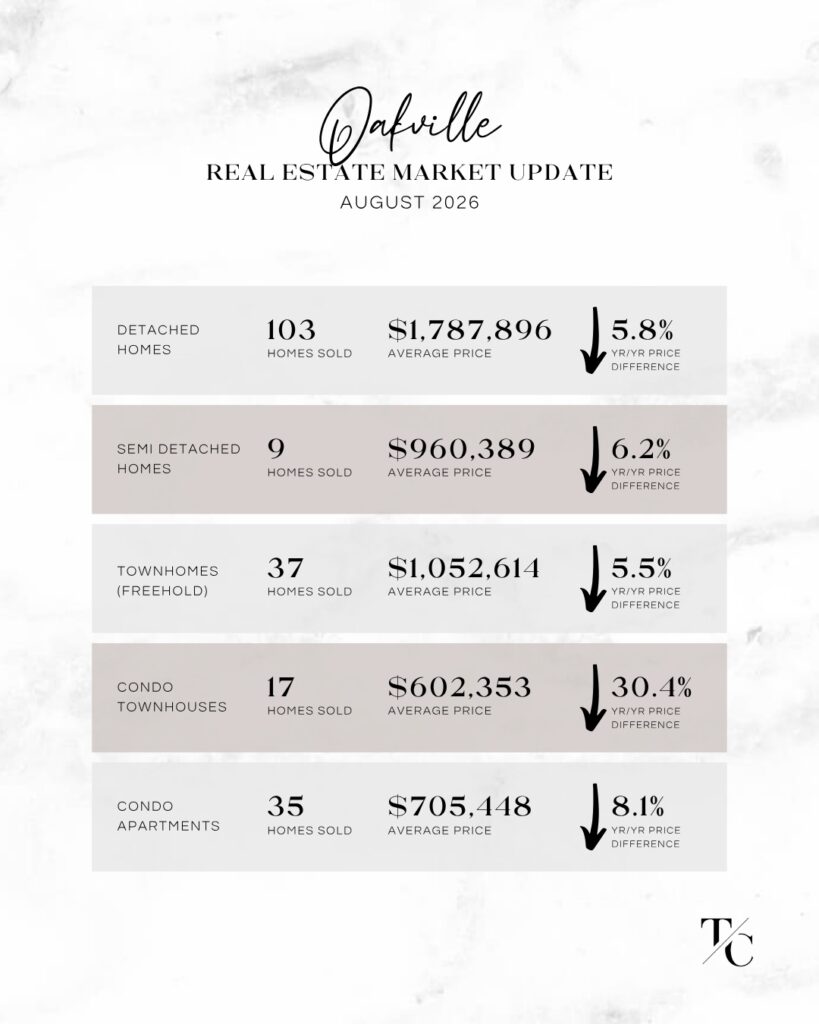
Oakville experienced more significant price movement in August, providing greater buying power for purchasers. The average detached home price declined by approximately $116,000 month over month, while detached sales volume was down approximately 24%. The average semi-detached home price was down approximately $125,000, while freehold townhouse prices remained relatively stable compared to July. Condo townhouses were down approximately $65,000 month over month, with an even more significant decline year over year: the average price was down a staggering 30.4%, from $865,624 in August 2025 to $602,353 in August 2026 — a difference of more than $263,000. Good news for Oakville’s condo apartment market: the average price saw a significant increase, up nearly $69,000, or 10.8%, month over month.

BURLINGTON REAL ESTATE MARKET – AUGUST 2026

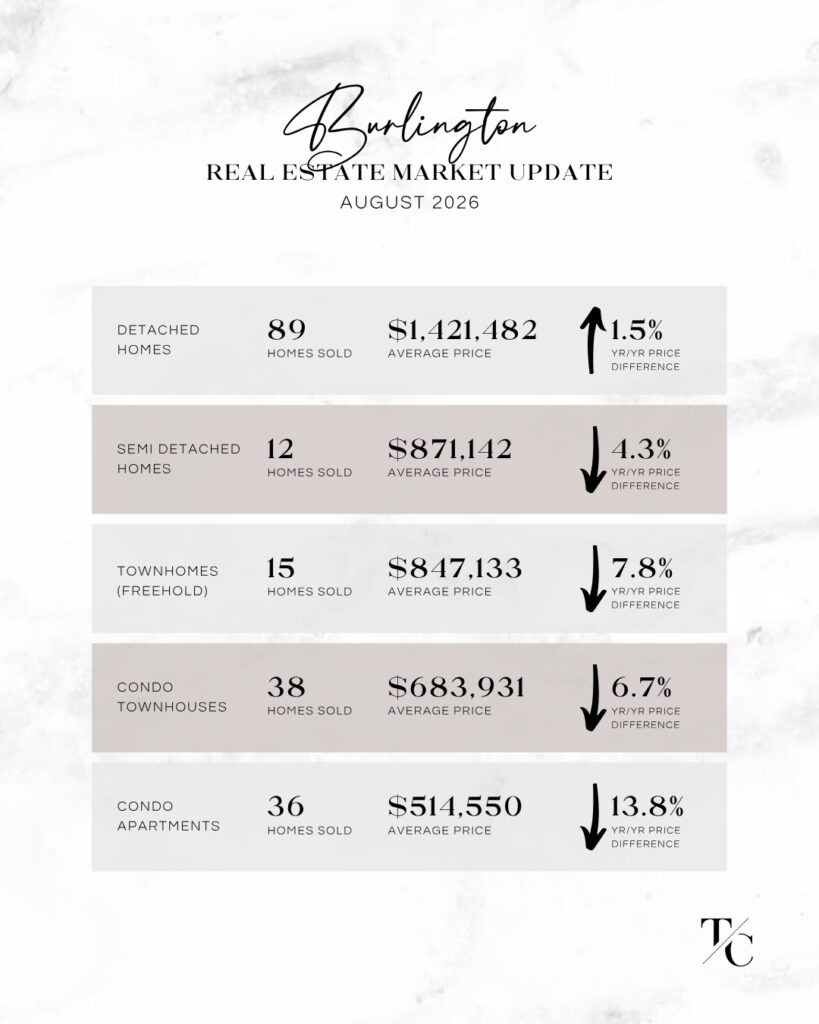
Burlington experienced some of the larger month-over-month price movements in August. The average detached home price increased by approximately $72,000, or just over 5%, while detached sales volume was down approximately 21%. Semi-detached prices were essentially flat, while freehold townhouse prices remained relatively stable. Condo townhouses saw a significant decline, with the average price down approximately $94,000, or 12%, month over month, despite sales volume increasing by approximately 27%. Opportunity knocks for Burlington condo buyers, as the average condo apartment price dropped approximately $123,000, or 19%, month over month. Condo apartment sales volume was also down approximately 22%. For context, the average condo apartment price in Burlington was down 13.8% year over year, making this another significant change worth noting.

Want to know what’s happening in your neighbourhood?

Obtain a personalized market analysis by booking a complimentary Buyer or Seller consultation via the form below.
 

August 2026 Market Stats - TorontoAugust 2026 Market Stats - MississaugaAugust 2026 Market Stats - OakvilleAugust 2026 Market Stats - Burlington

Connect with Us Today

Fill in a few details here and we will be in touch.

  • This field is for validation purposes and should be left unchanged.

Toronto Real Estate Market Update July 2026

Toronto & West GTA Real Estate Market Update – July 2026

Aug 18, 2026 | Burlington

𝐍𝐄𝐖𝐒𝐅𝐋𝐀𝐒𝐇! Here are the July 2026 real estate market stats you need to know for Toronto, Mississauga, Oakville and Burlington, including the latest home prices, sales activity and month-over-month market trends.

July brought a noticeable shift in activity as the summer market moved into full swing. Sales activity eased across several housing segments, while month-over-month pricing moved in different directions depending on location and property type. Year over year, home values also remain below July 2025 levels across many segments, continuing to create opportunities for buyers, although there were some notable exceptions.

On a broader market level, GTA REALTORS® reported 5,995 home sales through TRREB’s MLS® System in July 2026, down slightly by 0.9% compared to July 2025. New listings declined more significantly, down 17.8% year over year. The average GTA selling price was $1,003,956, down 4.5% compared to July 2025. On a seasonally adjusted basis, however, home sales increased 3.2% from June, suggesting underlying buyer activity continued even as the summer market produced more varied results across individual areas and housing types.

The July numbers reinforce just how localized today’s real estate market has become. Buyers continue to have opportunities in segments where prices have adjusted, while desirable, well-positioned properties can still attract meaningful interest. For sellers, understanding the most recent comparable sales and positioning a property appropriately for current conditions remains particularly important, as market performance can vary considerably by neighbourhood, housing type and price point.

𝗛𝗲𝗿𝗲 𝗮𝗿𝗲 𝗼𝘂𝗿 𝗸𝗲𝘆 𝘁𝗮𝗸𝗲𝗮𝘄𝗮𝘆𝘀 𝗼𝗻 𝘁𝗵𝗲 𝗺𝗼𝗻𝘁𝗵 𝗼𝘃𝗲𝗿 𝗺𝗼𝗻𝘁𝗵 𝗮𝗰𝘁𝗶𝘃𝗶𝘁𝘆 𝗯𝗲𝘁𝘄𝗲𝗲𝗻 𝗝𝘂𝗻𝗲 𝟮𝟬𝟮𝟲 𝗮𝗻𝗱 𝗝𝘂𝗹𝘆 𝟮𝟬𝟮𝟲:

Toronto Real Estate Market – July 2026

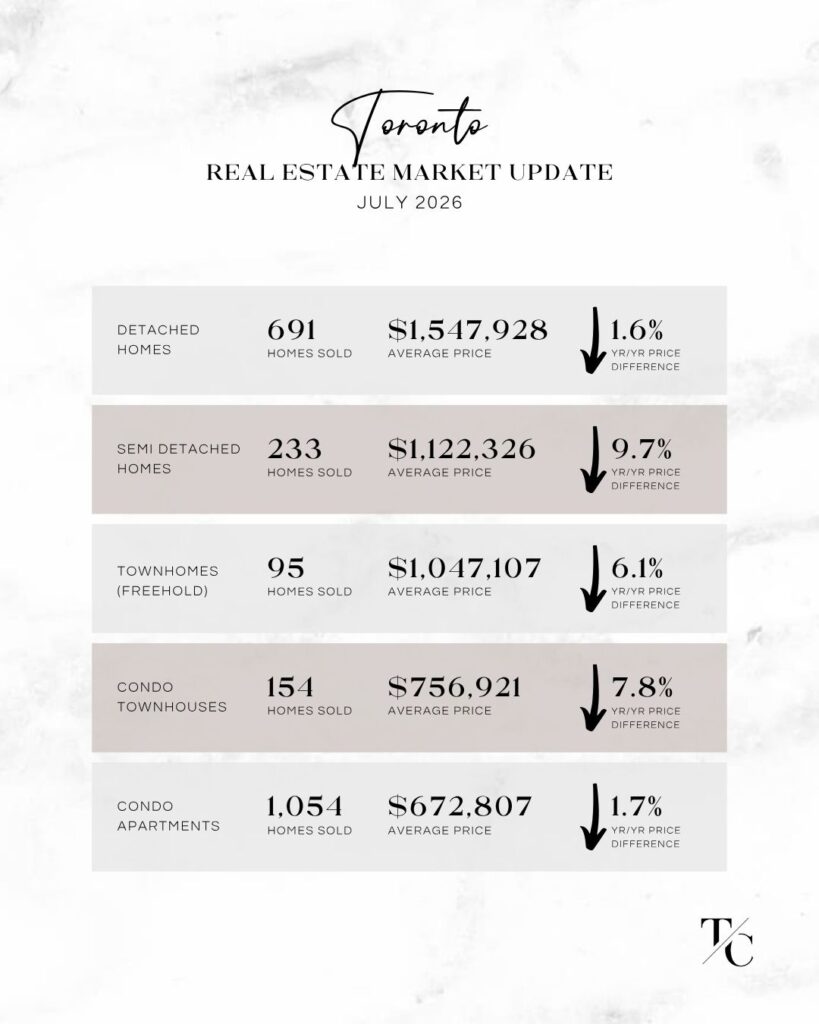
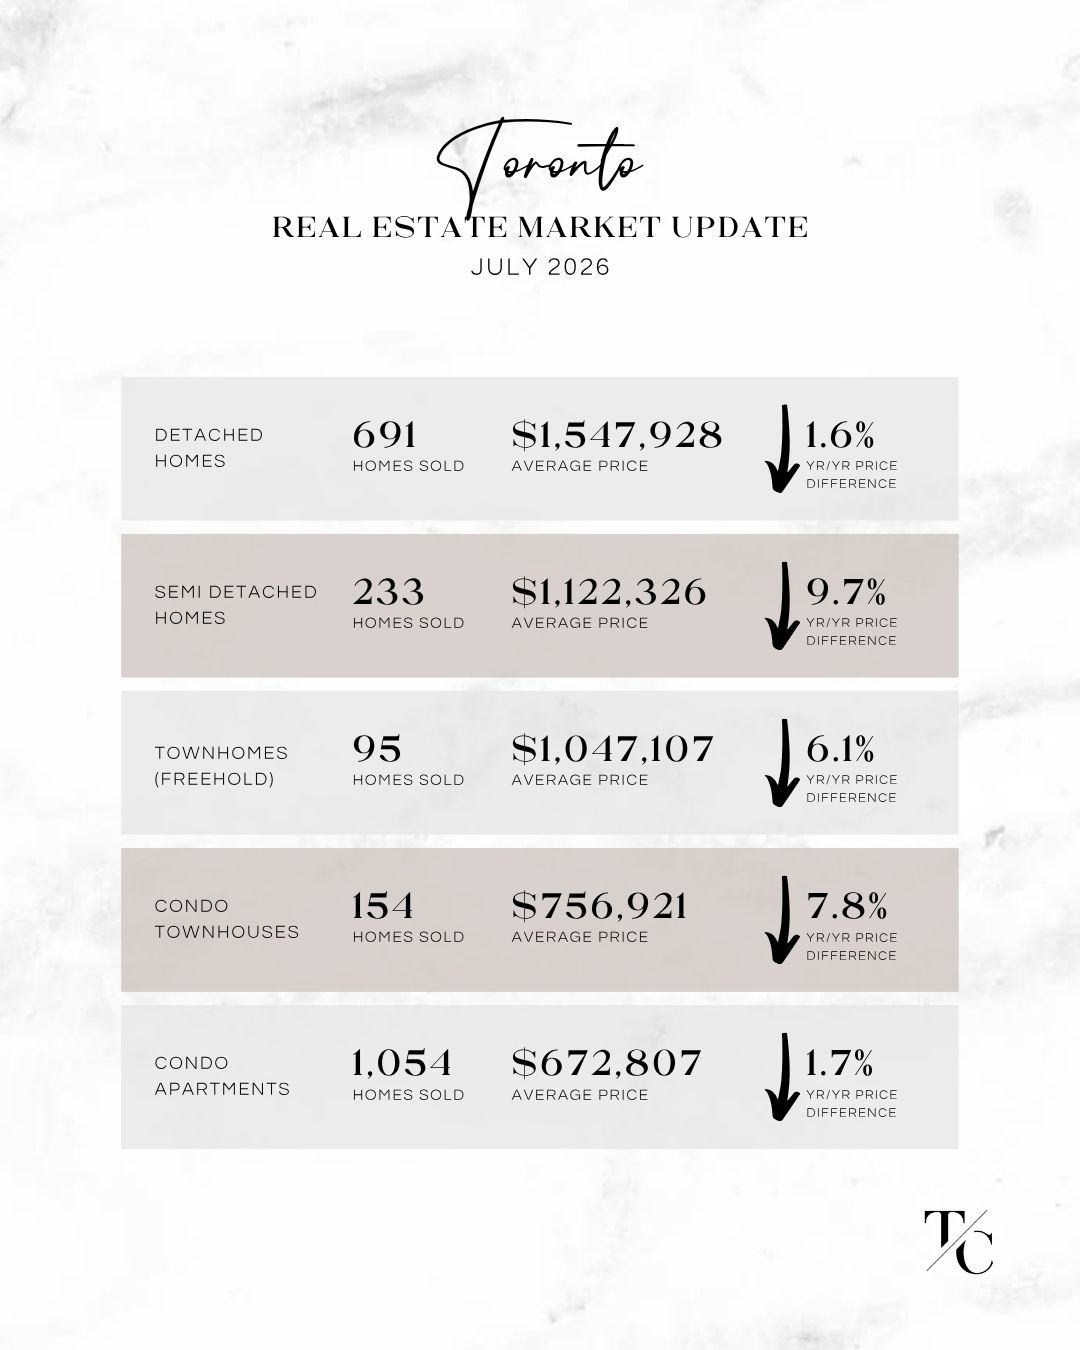
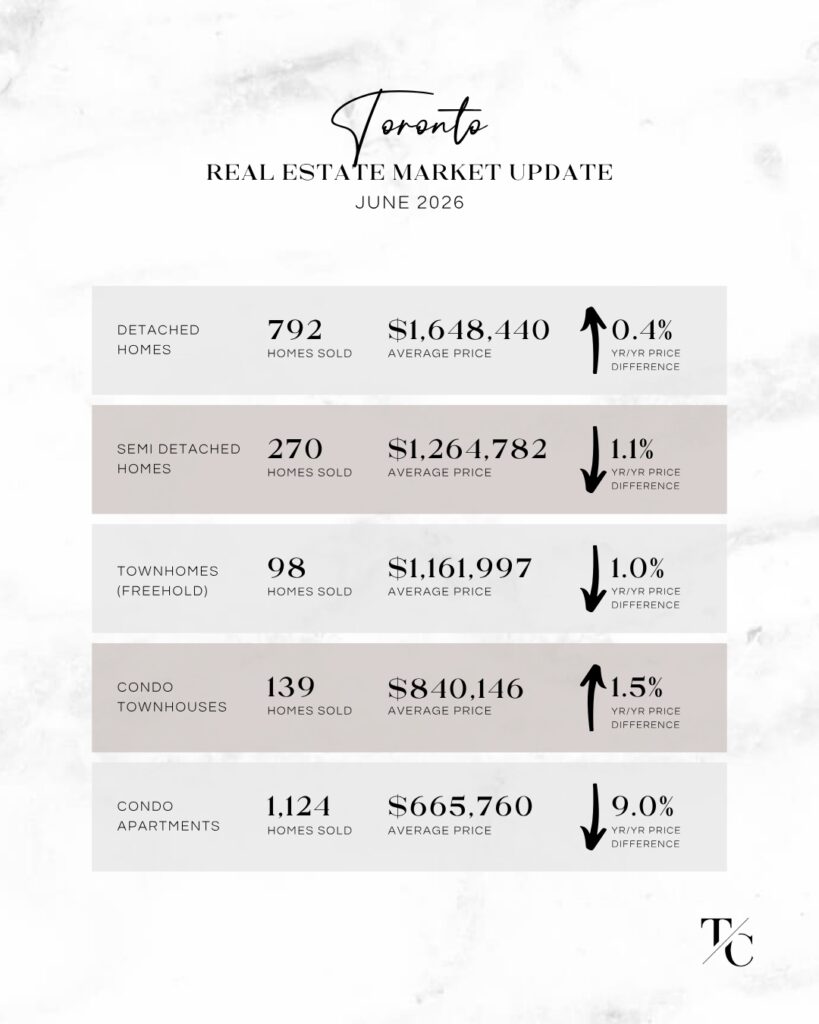
Toronto experienced softer pricing and sales activity across much of the freehold market in July. Average detached home values declined by approximately $100,500 month over month, or 6.1%, while the number of detached homes sold decreased by nearly 13%. Semi-detached homes experienced an even larger price adjustment, with average values declining by approximately $142,500, or 11.3%, alongside lower sales activity.

Freehold townhome values also softened by approximately $115,000. Condo townhomes declined by roughly $83,000 in average price, although the number of condo townhomes sold increased by nearly 11%. Condo apartments were Toronto’s most stable segment, with average values increasing modestly by approximately $7,000 compared to June.

Mississauga Real Estate Market – July 2026

Mississauga recorded the largest month-over-month detached home price adjustment across all areas in our report, with average values declining by approximately $225,000, or 15.2%. The number of detached homes sold also decreased by nearly 19%, indicating a notable summer slowdown in this segment.

Semi-detached values were comparatively stable, declining by approximately $17,000. Freehold townhomes moved in the opposite direction, with average values increasing by nearly $29,000 and the number of homes sold rising by approximately 28%. Condo townhome and condo apartment values were relatively stable, each declining by approximately $14,000 compared to June.

Oakville Real Estate Market – July 2026

Oakville saw some of July’s most contrasting results. Average detached home values increased by approximately $91,000 month over month, or 5%, despite the number of detached homes sold declining by nearly 23%. This divergence is an important reminder that an increase in average price does not necessarily mean the broader market strengthened, as the mix of properties sold in any given month can influence average values.

Semi-detached values remained relatively stable, although only seven homes sold, making this a particularly small sample size. Freehold townhome values declined by approximately $50,500, while condo apartment values decreased by approximately $58,000.

Condo townhomes experienced Oakville’s most significant monthly adjustment, declining by approximately $280,000, or nearly 30%. With only 20 condo townhomes sold in July, the composition and price points of those transactions likely had a considerable influence on the monthly average.

Burlington Real Estate Market – July 2026

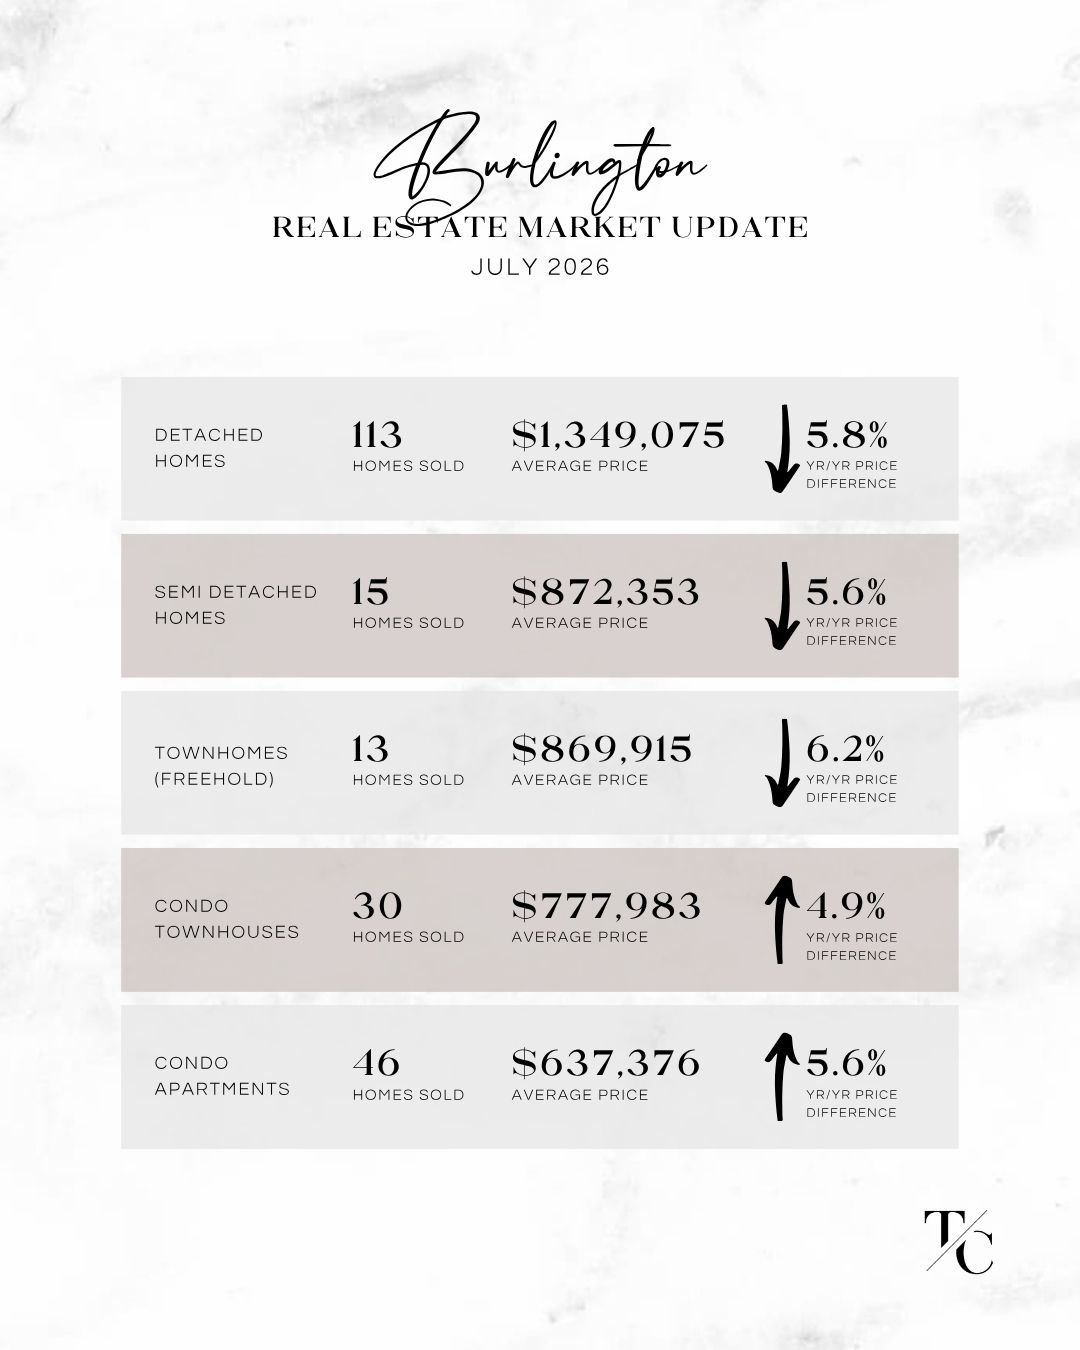
Burlington’s average detached home values declined by approximately $80,000 month over month, or 5.6%, while the number of detached homes sold decreased by more than 31%, marking one of the more notable declines in sales activity across the areas in our report.

Semi-detached values softened by approximately $23,000, while the number of semi-detached homes sold increased by 25%; however, this represented only 15 transactions and therefore a relatively small sample size. Freehold townhome values declined by approximately $27,000.

Condo townhomes were Burlington’s standout segment, with average values increasing by approximately $65,000, or 9.1%, even as the number of condo townhomes sold declined by approximately 21%. Condo apartment values moved in the opposite direction, declining by approximately $47,000 compared to June.

What Does the July 2026 Real Estate Market Mean for Buyers and Sellers?

Overall, July’s month-over-month results point to a market where buyers remain selective and price sensitivity continues to play an important role. At the same time, the significant year-over-year decline in new listings across the broader GTA is worth watching. If inventory continues to contract while buyer activity holds or strengthens, the balance between supply and demand could begin to shift as we move toward the fall market.

For buyers, the current environment continues to offer opportunities, particularly within segments where pricing has adjusted and competition remains limited. Having negotiating leverage, however, does not mean every property represents the same opportunity. Desirable homes that are appropriately priced and well positioned can still attract meaningful interest.

For sellers, the considerable variation between areas and housing types reinforces the importance of looking beyond broad market averages. Current neighbourhood-level data, recent comparable sales, property condition and pricing strategy all play an important role in determining how a home will perform in today’s market.

Want to Know What’s Happening in Your Neighbourhood?

Obtain a personalized market analysis by booking a complimentary Buyer or Seller consultation via the form below.
Toronto Real Estate Market Update July 2026Mississauga Real Estate Market Update July 2026Oakville Real Estate Market Update July 2026Burlington Real Estate Market Update July 2026


Book a Complimentary Consultation

Fill in a few details here to get in touch.

  • This field is for validation purposes and should be left unchanged.

Toronto Real Estate Market Update May 2026

Toronto & West GTA Real Estate Market Update – May 2026

Jun 12, 2026 | Market News

📣 𝐍𝐄𝐖𝐒𝐅𝐋𝐀𝐒𝐇! Here are the real estate market stats you need to know for May 2026 vs. 2025 home sales in Toronto, Mississauga, Oakville and Burlington.

May continued to show stronger spring market activity, with the number of homes sold increasing across several key segments compared to April. Detached homes remained a major driver of activity across all four areas, while price movement varied significantly by property type and location.

On a broader market level, 6,583 home sales were reported through TRREB’s MLS® System in May 2026, up 6.3% compared to May 2025. At the same time, new listings totalled 17,698, down 18.9% year over year — approximately 4,100 fewer listings than the same time last year. This is an important shift: the number of homes sold is rising while fewer new listings are coming to market, which may gradually increase competitive pressure in desirable neighbourhoods as inventory tightens.

The month over month data reflects this continued spring activity, with the number of detached homes sold increasing across all four areas we track — up 10% in Toronto, 6% in Mississauga, 14% in Oakville and 15% in Burlington between April and May alone.

𝗛𝗲𝗿𝗲 𝗮𝗿𝗲 𝗼𝘂𝗿 𝗸𝗲𝘆 𝘁𝗮𝗸𝗲𝗮𝘄𝗮𝘆𝘀 𝗼𝗻 𝘁𝗵𝗲 𝗺𝗼𝗻𝘁𝗵 𝗼𝘃𝗲𝗿 𝗺𝗼𝗻𝘁𝗵 𝗮𝗰𝘁𝗶𝘃𝗶𝘁𝘆 𝗯𝗲𝘁𝘄𝗲𝗲𝗻 𝗔𝗽𝗿𝗶𝗹 𝟮𝟬𝟮𝟲 𝗮𝗻𝗱 𝗠𝗮𝘆 𝟮𝟬𝟮𝟲:

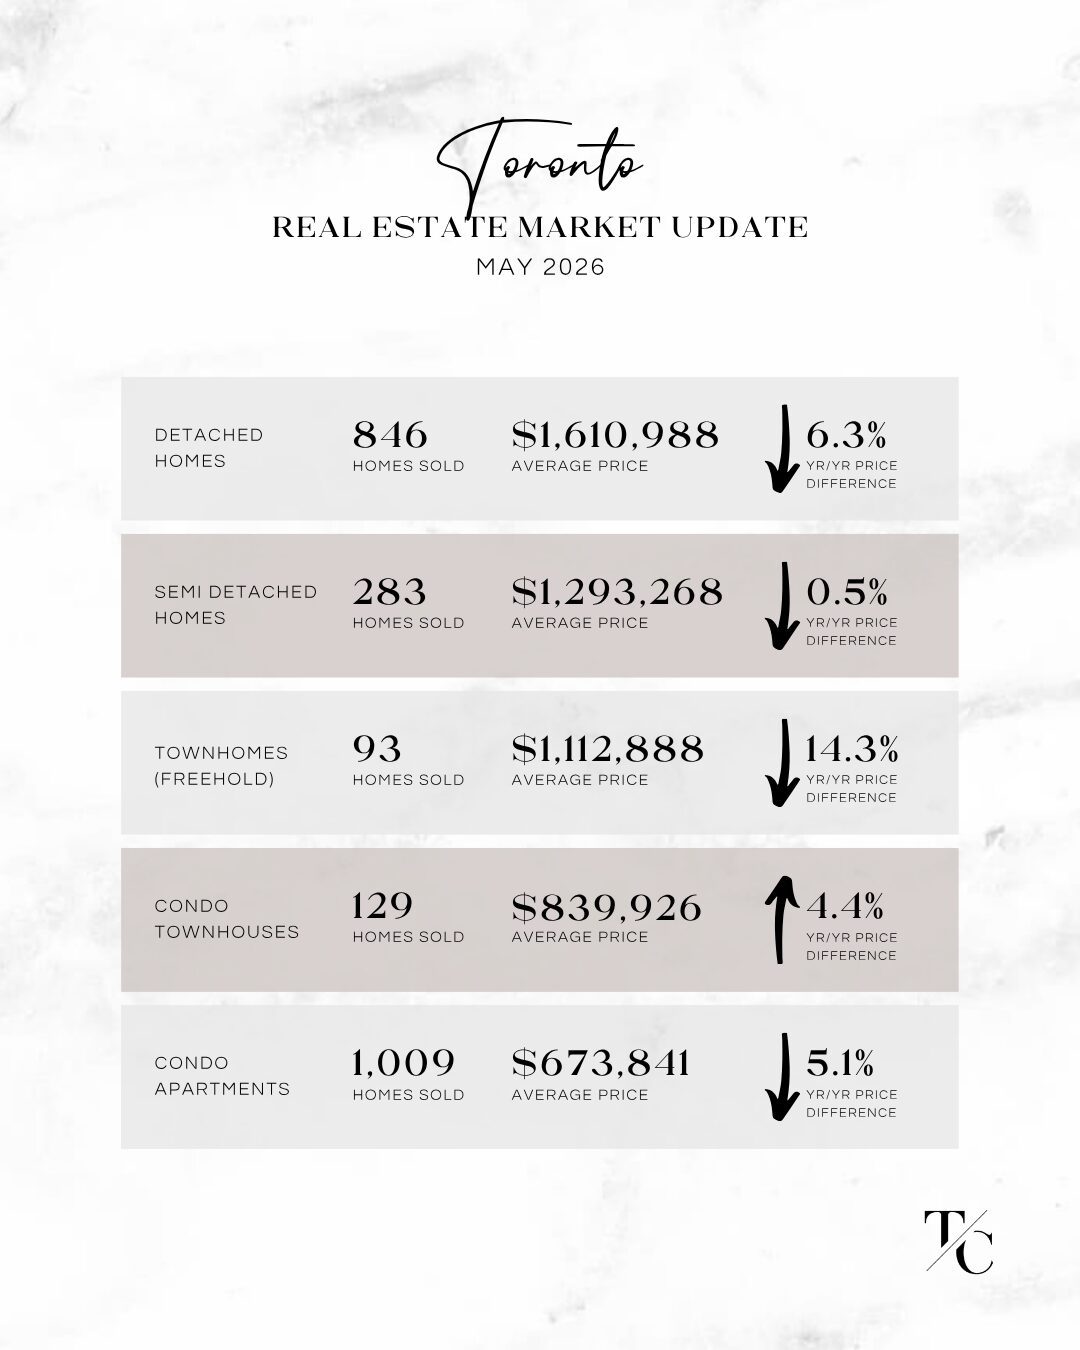
◼️ Toronto’s average detached home values declined by approximately $58,000 month over month, although the number of detached homes sold increased by 76 — a 10% increase over April. Semi-detached home values were near flat to the month prior, while the number of semi-detached homes sold increased by 46, representing a 19% gain. Freehold townhomes saw Toronto’s largest monthly price correction, falling by roughly $172,200, while the number of homes sold increased by 5, up 6%. Condo townhome values strengthened by approximately $84,100, although the number of homes sold declined by 13 units, down 9%. Condo apartment values were near flat to the month prior, while the number of homes sold decreased by 45 units, down 4%.

◼️ Mississauga’s detached home values were near flat month over month, while the number of detached homes sold increased by 14 — a 6% increase over April. Semi-detached home values were also near flat, with the number of homes sold increasing by 6, up 9%. Freehold townhome values strengthened by approximately $68,900, although the number of homes sold declined by 2, down 11%. Condo townhome values were near flat to the month prior, while the number of homes sold increased by 13 units — an 18% increase. Condo apartment values were also near flat, while the number of homes sold increased by 21 units, up 16%.

◼️ Oakville’s average detached home values declined by approximately $104,000 month over month, although the number of detached homes sold increased by 22 — a 14% increase over April. Semi-detached home values were near flat to the month prior, while the number of homes sold increased by 4, representing a 67% increase; however, this reflects a small sample size with only 10 semi-detached homes sold in May. Freehold townhome values recorded Oakville’s strongest monthly price gain, rising by approximately $119,700, while the number of homes sold increased by 11, up 33%. Condo townhome values increased by approximately $24,000, while the number of homes sold was essentially flat to the month prior, with one fewer home sold than April. Condo apartment values also strengthened significantly, rising by approximately $135,900, while the number of homes sold increased by 15 units — a 58% increase month over month.

◼️ Burlington’s detached home values strengthened by approximately $139,900 month over month, while the number of detached homes sold increased by 18 — a 15% increase over April. Semi-detached home values rose by roughly $56,800, although the number of homes sold declined by 5, down 31%; this also reflects a smaller sample size with only 11 semi-detached homes sold in May. Freehold townhome values were near flat to the month prior, while the number of homes sold declined by 11, down 44%. Condo townhome values increased by approximately $41,400, while the number of homes sold jumped by 20 units — a 54% increase month over month. Condo apartment values strengthened by approximately $56,600, while the number of homes sold remained relatively flat, up by 2 units, representing a 4% increase over April.

Overall, May showed continued buyer activity across several segments, especially detached homes. While pricing remained mixed depending on area and housing type, the increase in the number of homes sold, combined with fewer new listings entering the market year over year, suggests conditions are gradually tightening as we move further into the spring market.

𝘞𝘢𝘯𝘵 𝘵𝘰 𝘬𝘯𝘰𝘸 𝘸𝘩𝘢𝘵’𝘴 𝘩𝘢𝘱𝘱𝘦𝘯𝘪𝘯𝘨 𝘪𝘯 𝘺𝘰𝘶𝘳 𝘯𝘦𝘪𝘨𝘩𝘣𝘰𝘶𝘳𝘩𝘰𝘰𝘥?

Obtain a personalized market analysis by booking a complimentary Buyer or Seller consultation by phone at 647-293-3785 or via the form below.

Toronto Real Estate Market Update May 2026Mississauga Real Estate Market Update May 2026Burlington Real Estate Market Update May 2026Oakville Real Estate Market Update May 2026

Get in touch

Get assistance with your next real estate purchase or sale. Reach out here.

  • This field is for validation purposes and should be left unchanged.

Toronto & West GTA Real Estate Market Update – April 2026

May 13, 2026 | Market News

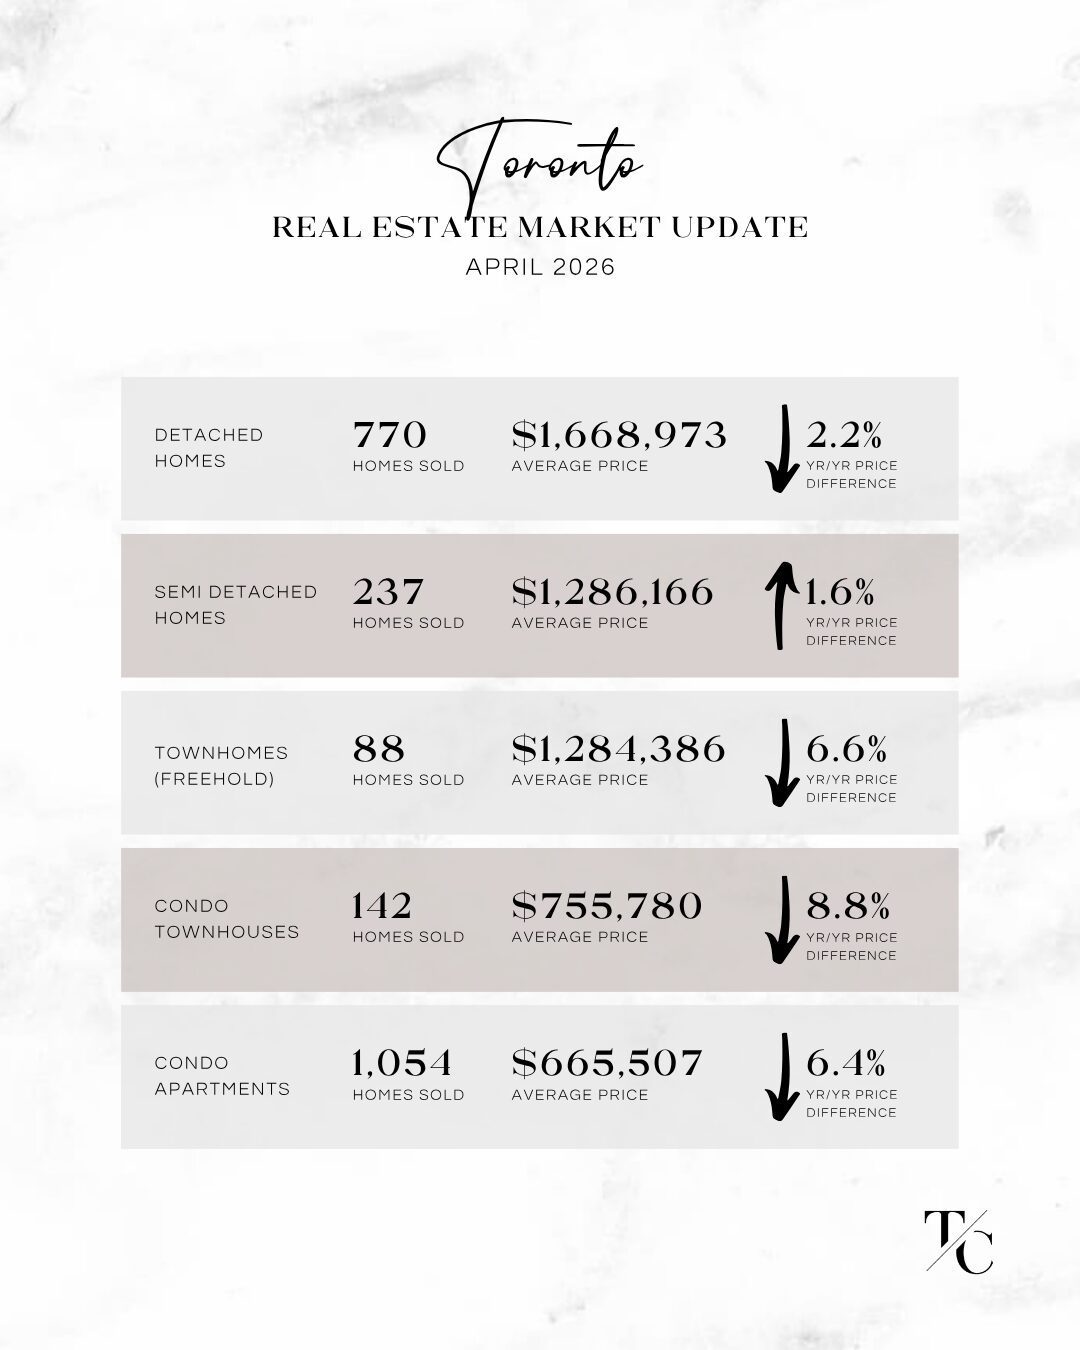
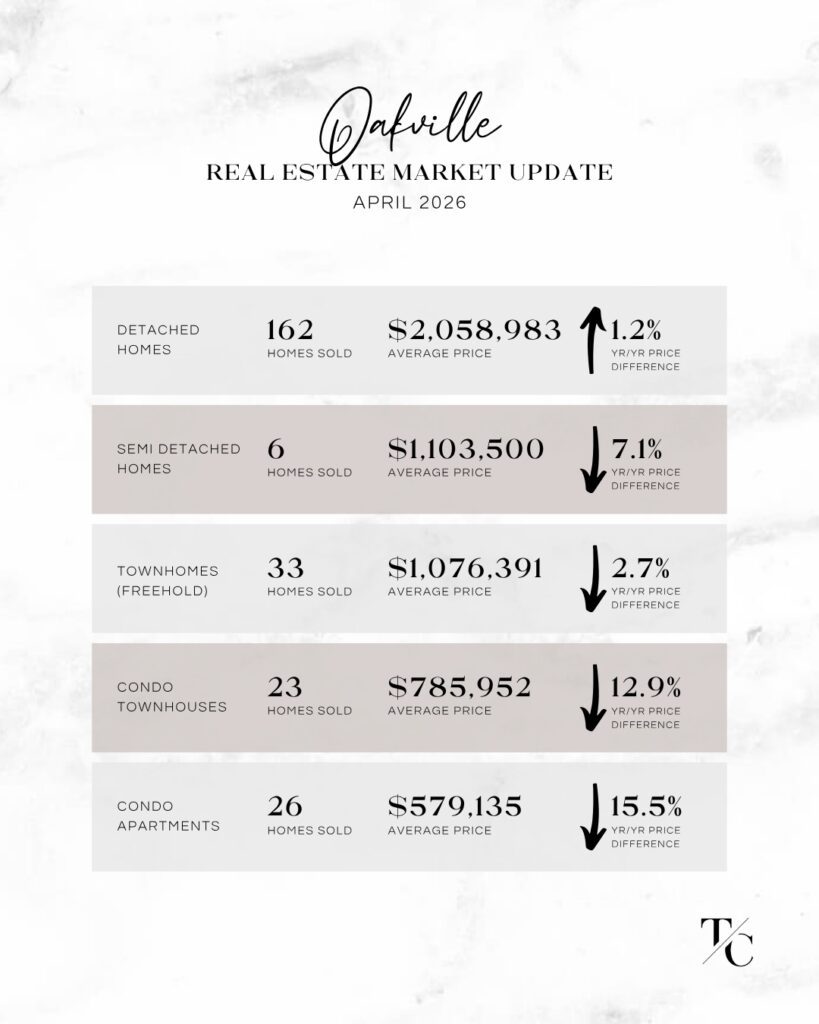
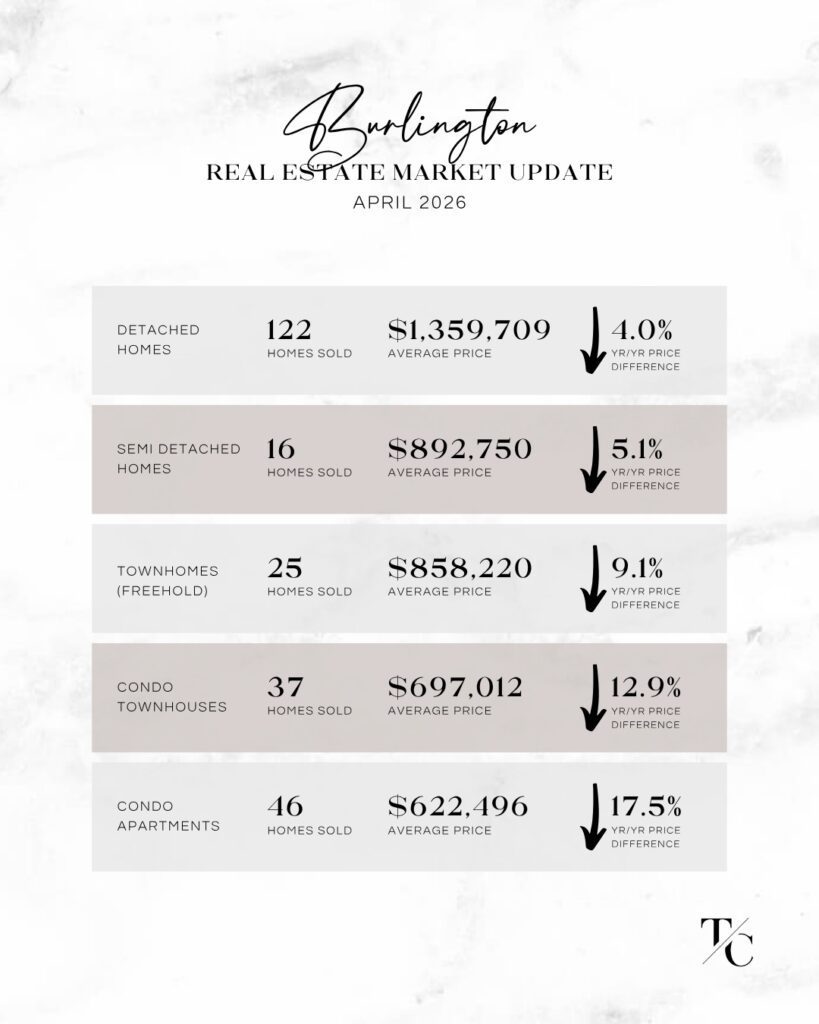
📣 𝐍𝐄𝐖𝐒𝐅𝐋𝐀𝐒𝐇! Here are the real estate market stats you need to know for April 2026 vs. 2025 home sales in Toronto, Mississauga, Oakville and Burlington.

April continued the momentum we began seeing in March, with many housing segments across the GTA reporting stronger month over month sales activity as buyers became increasingly active throughout the spring market. Detached and semi-detached homes saw particularly notable gains in several areas, while pricing trends remained mixed depending on location and property type. Although buyers continue to benefit from negotiating opportunities in some segments, tighter inventory levels are beginning to create more competition for well-priced homes in desirable neighbourhoods.

On a broader market level, GTA REALTORS® reported 5,946 home sales through TRREB’s MLS® System in April 2026 — up 7% compared to April 2025. Meanwhile, new listings totalled 17,097, down 9.3% year over year — approximately 1,750 fewer listings than the same time last year. Month over month, both sales and new listings increased compared to March, although sales grew at a faster pace, further signalling tightening market conditions as the spring market continues to unfold.

𝗛𝗲𝗿𝗲 𝗮𝗿𝗲 𝗼𝘂𝗿 𝗸𝗲𝘆 𝘁𝗮𝗸𝗲𝗮𝘄𝗮𝘆𝘀 𝗼𝗻 𝘁𝗵𝗲 𝗺𝗼𝗻𝘁𝗵 𝗼𝘃𝗲𝗿 𝗺𝗼𝗻𝘁𝗵 𝗮𝗰𝘁𝗶𝘃𝗶𝘁𝘆 𝗯𝗲𝘁𝘄𝗲𝗲𝗻 𝗠𝗮𝗿𝗰𝗵 𝟮𝟬𝟮𝟲 𝗮𝗻𝗱 𝗔𝗽𝗿𝗶𝗹 𝟮𝟬𝟮𝟲:

◼️ Toronto’s average detached home values increased by approximately $55,900 month over month, while the number of detached homes sold rose by 196 — a strong 34% increase over March. Semi-detached home values were also up by roughly $54,200, accompanied by 67 more homes sold, representing a 39% increase. Freehold townhome values climbed by approximately $83,800, although the number of homes sold remained essentially flat to the month prior, up by just one sale. Condo townhome values declined by roughly $28,900, while the number of homes sold increased by 22 — an 18% gain month over month. Condo apartment values increased modestly by approximately $17,200, with the number of homes sold up by 103 units, marking an 11% increase over March.

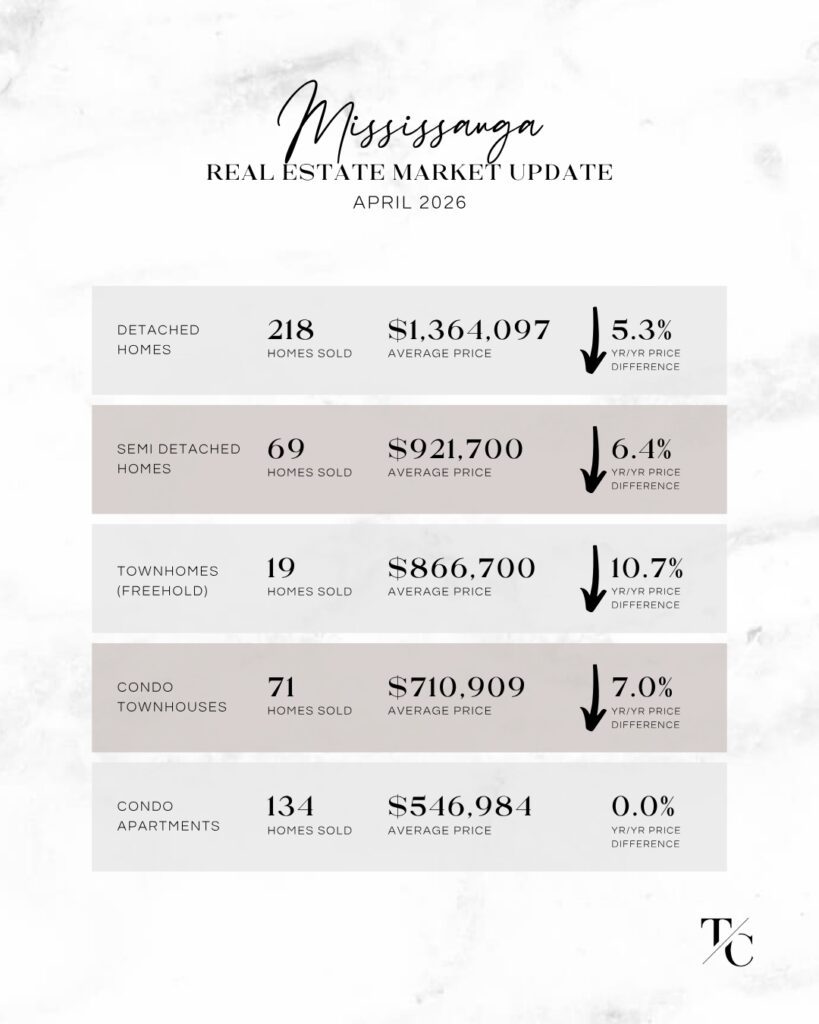
◼️ Mississauga’s average detached home values declined by approximately $72,300 month over month, although the number of detached homes sold increased by 53 — a solid 32% rise over March. Semi-detached home pricing remained relatively flat to the month prior, while the number of homes sold increased by 6, representing a 10% gain. Freehold townhome values softened by approximately $67,600, although the number of homes sold jumped by 8 — a notable 73% increase month over month. Condo townhome pricing remained essentially flat, while the number of homes sold declined by 11 units, down 13% compared to March. Condo apartment values increased by approximately $19,200, accompanied by 8 more homes sold — a modest 6% increase month over month.

◼️ Oakville’s average detached home values surged by approximately $227,000 month over month, while the number of detached homes sold increased by 67 — an impressive 71% increase over March. Semi-detached home values were up by roughly $28,500, although the number of homes sold declined by 4 units, down 40%; however, this reflects a very small sample size, with only 6 semi-detached homes sold in April. Freehold townhome values rebounded by approximately $60,500, while the number of homes sold declined by 5, representing a 13% decrease month over month. Condo townhome pricing remained essentially flat to March, while the number of homes sold increased by 4 units — a 21% increase. Condo apartment values experienced Oakville’s sharpest monthly adjustment, declining by nearly $140,000, while the number of homes sold dipped by 2 units, down 7% month over month.

◼️ Burlington’s average detached home values declined by approximately $70,500 month over month, although the number of detached homes sold increased by 16 — a 15% rise over March. Semi-detached pricing remained relatively flat to the month prior, while the number of homes sold jumped by 10, representing a substantial 167% increase; however, this reflects a very small sample size, with only 16 semi-detached homes sold in April. Freehold townhome values declined by approximately $39,800, while the number of homes sold increased by 11 — an impressive 79% increase month over month. Condo townhome values softened by roughly $82,100, while the number of homes sold dipped slightly by 2 units, down 5% compared to March. Condo apartment values declined by approximately $32,500, although the number of homes sold increased by 4 units, representing a 10% increase month over month.

𝘞𝘢𝘯𝘵 𝘵𝘰 𝘬𝘯𝘰𝘸 𝘸𝘩𝘢𝘵’𝘴 𝘩𝘢𝘱𝘱𝘦𝘯𝘪𝘯𝘨 𝘪𝘯 𝘺𝘰𝘶𝘳 𝘯𝘦𝘪𝘨𝘩𝘣𝘰𝘶𝘳𝘩𝘰𝘰𝘥?

Obtain a personalized market analysis by booking a complimentary Buyer or Seller consultation by phone at 647-293-3785 or via the form below.

Toronto real estate market update April 2026Oakville real estate market update April 2026Burlington real estate market update April 2026Mississauga real estate market update April 2026

Do you have questions about the real estate market?

Fill in the form. below to reach out.

  • This field is for validation purposes and should be left unchanged.

January 2026 Real Estate Market Report - Toronto

Toronto & West GTA Real Estate Market Update – January 2026

Feb 26, 2026 | Market News

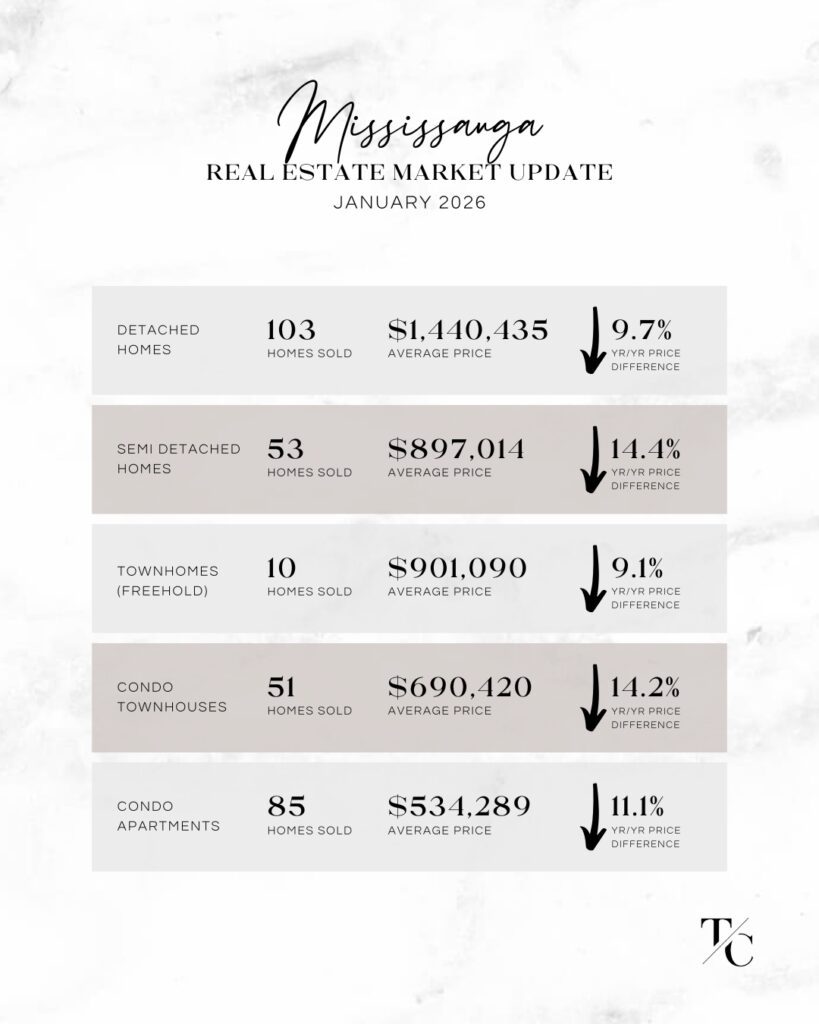
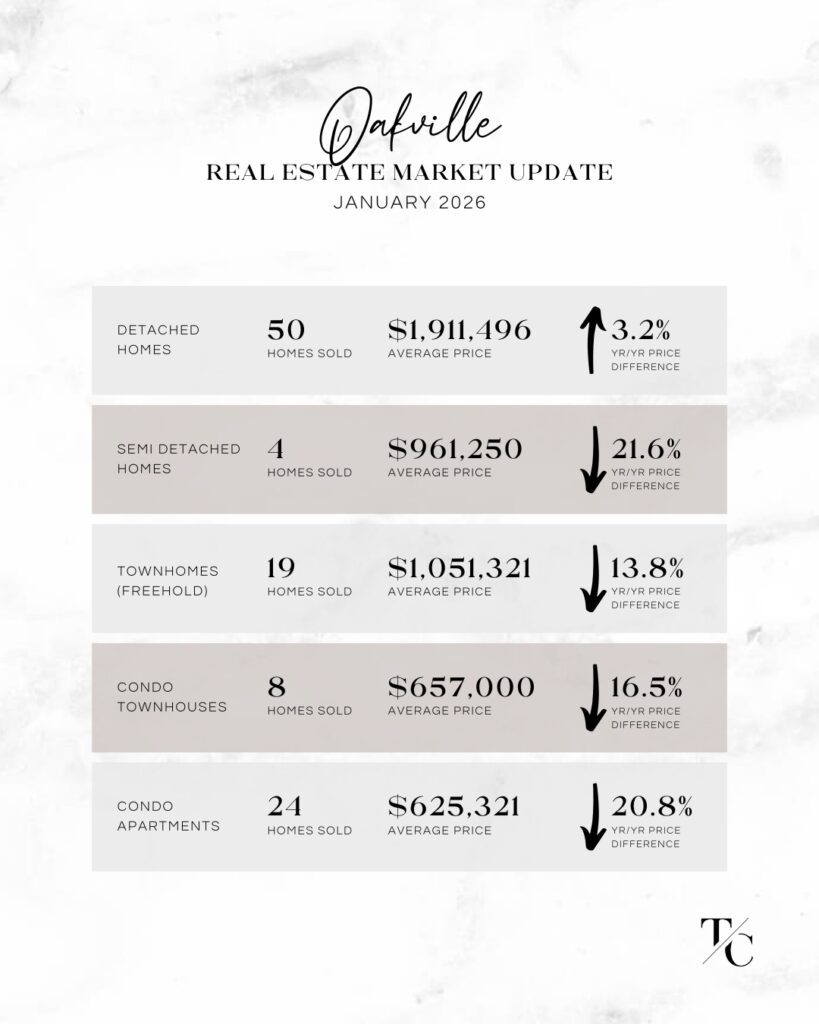
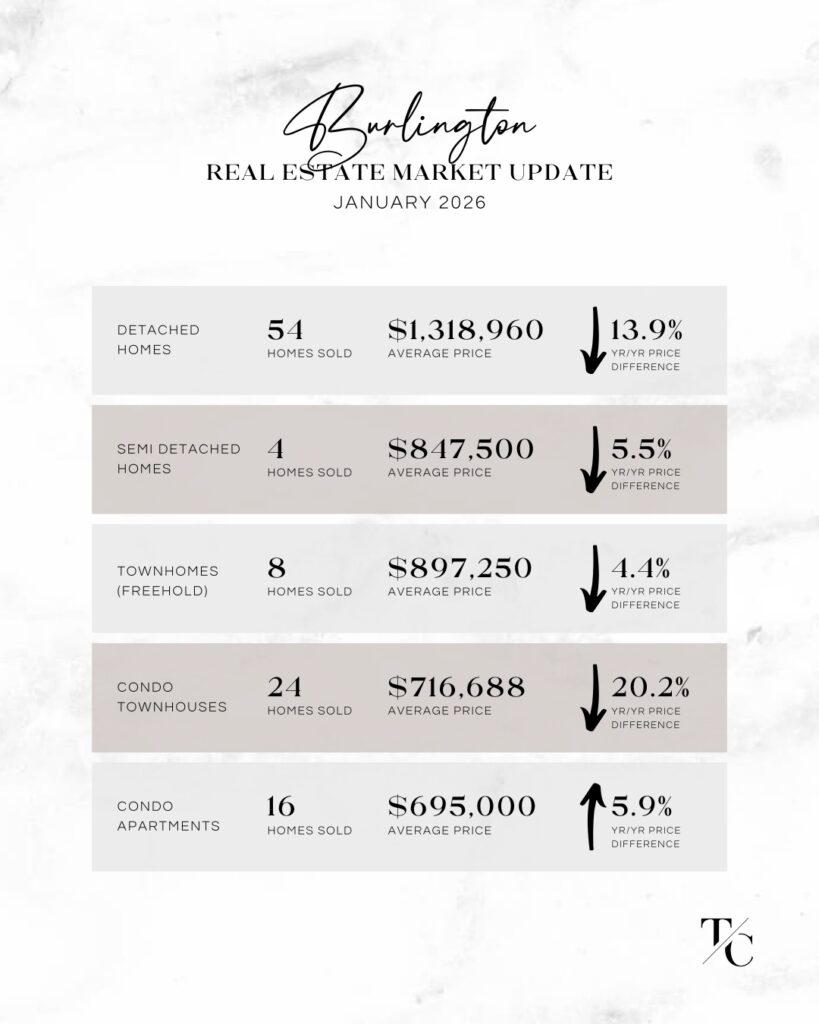
📣 𝐍𝐄𝐖𝐒𝐅𝐋𝐀𝐒𝐇! Here are the real estate market stats you need to know for January 2026 vs. 2025 home sales in Toronto, Mississauga, Oakville, Burlington.

Market conditions remained in buyers’ favour to start 2026. Home sales have declined at a faster pace than new listings, giving buyers more choice and greater negotiating power than this time last year. From December to January, sales activity slowed as expected following the holiday season, while pricing trends varied by housing type and location. Overall, buyers continue to move cautiously, and sellers are facing increased competition across most segments.

𝗛𝗲𝗿𝗲 𝗮𝗿𝗲 𝗼𝘂𝗿 𝗸𝗲𝘆 𝘁𝗮𝗸𝗲𝗮𝘄𝗮𝘆𝘀 𝗼𝗻 𝘁𝗵𝗲 𝗺𝗼𝗻𝘁𝗵 𝗼𝘃𝗲𝗿 𝗺𝗼𝗻𝘁𝗵 𝗮𝗰𝘁𝗶𝘃𝗶𝘁𝘆 𝗯𝗲𝘁𝘄𝗲𝗲𝗻 𝗗𝗲𝗰𝗲𝗺𝗯𝗲𝗿 𝟮𝟬𝟮𝟱 𝗮𝗻𝗱 𝗝𝗮𝗻𝘂𝗮𝗿𝘆 𝟮𝟬𝟮𝟲:

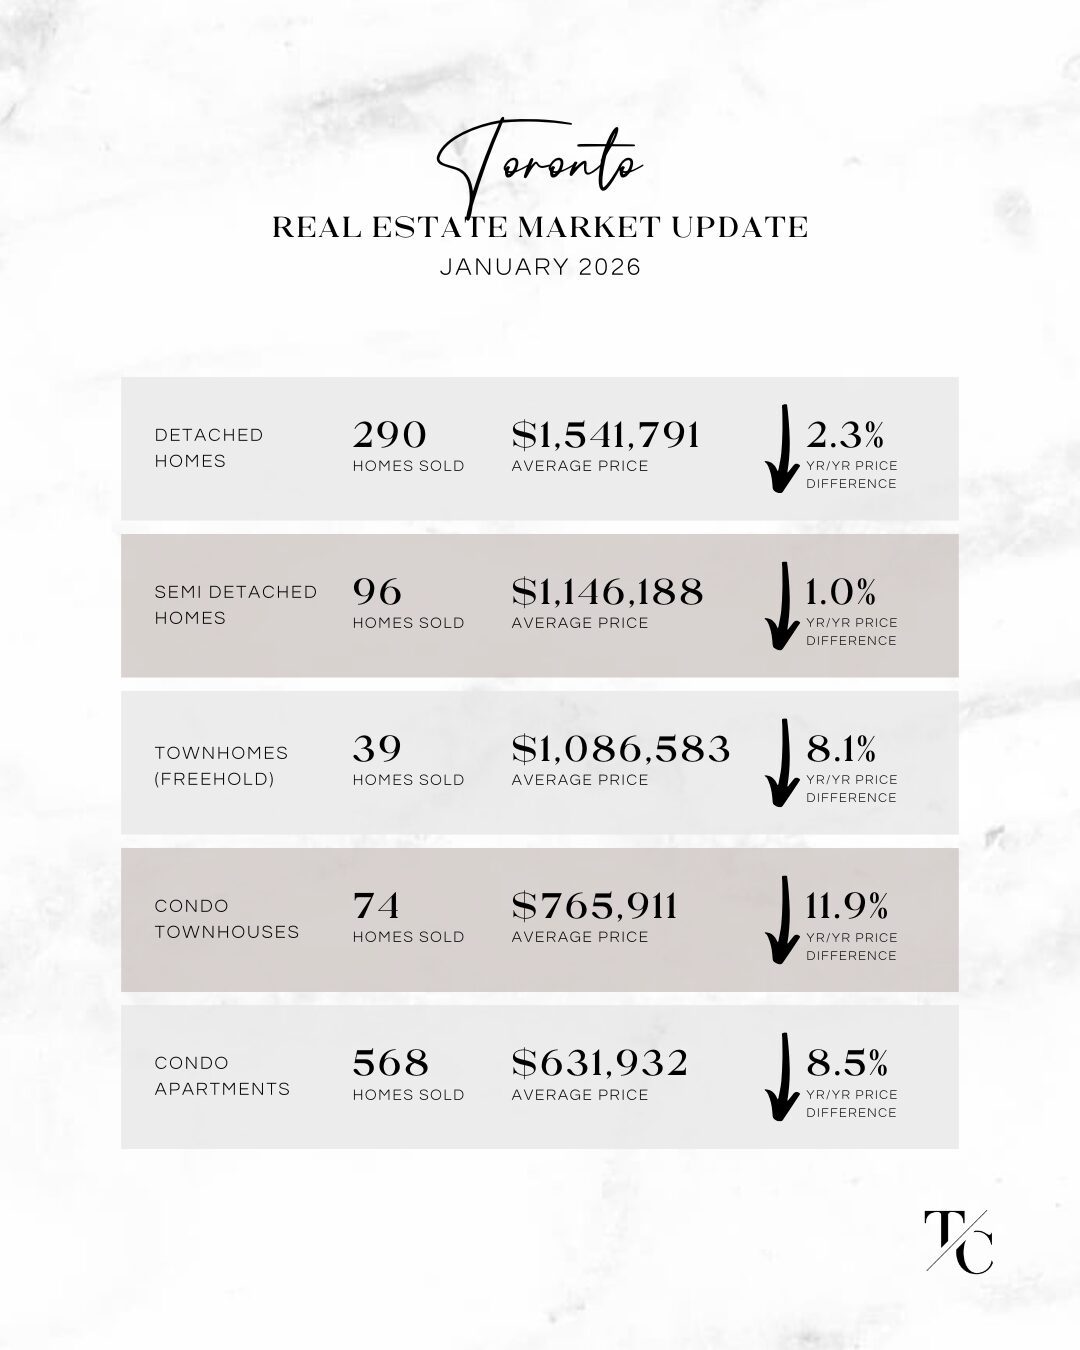
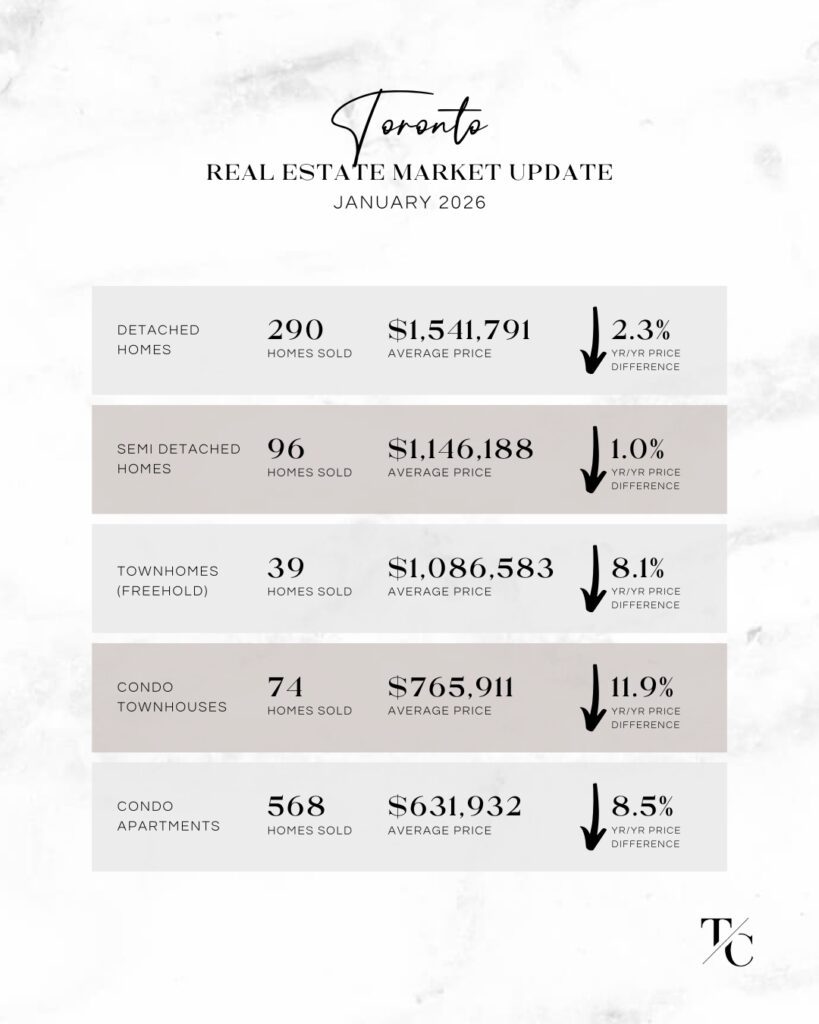
◼️ Toronto’s average detached home values increased slightly, by approximately $44,000 month over month, while semi-detached homes edged upward by $24,000 despite fewer sales. Freehold townhomes saw the largest adjustment among Toronto home types, declining nearly $140,000 from December’s average price. Condo townhomes were essentially flat month over month, down slightly by about $19,000. Condo apartments decreased by approximately $31,000, alongside a notable drop in sales activity with 150 fewer units sold.

◼️ Mississauga’s average detached home values remained relatively flat, up $26,000 month over month even as sales slowed with 25 fewer homes sold. Semi-detached home values declined slightly, while freehold townhome values held steady compared to the month prior. Condo townhouse values declined by approximately $37,000 month over month, whereas condo apartments rebounded, increasing close to $23,000 compared to December, with the number of condos sold holding steady as well.

◼️ Oakville’s average detached home values saw a significant rebound, rising more than $200,000 month over month, marking the strongest price movement across all home types and areas in our report. There were only four semi-detached homes sold, at an average price down nearly $133,000 from the month prior. Freehold townhomes experienced another sharp adjustment, declining almost $297,000 month over month. Condo townhomes also fell by about $116,000, suggesting buyers in the semi-detached and townhome segments were more price sensitive to start the year. Condo apartment activity increased, both in the number of units sold and in average price, which rose approximately $42,000 month over month.

◼️ Burlington’s average detached home values increased approximately $50,000, continuing to show steady demand. Semi-detached home values declined slightly — essentially flat, down only about $14,000 — while freehold townhomes gained nearly $61,000. Condo townhomes also strengthened, rising roughly $54,000. Condo apartment pricing remained stable, essentially flat compared to the month prior.

𝘞𝘢𝘯𝘵 𝘵𝘰 𝘬𝘯𝘰𝘸 𝘸𝘩𝘢𝘵’𝘴 𝘩𝘢𝘱𝘱𝘦𝘯𝘪𝘯𝘨 𝘪𝘯 𝘺𝘰𝘶𝘳 𝘯𝘦𝘪𝘨𝘩𝘣𝘰𝘶𝘳𝘩𝘰𝘰𝘥?

Obtain a personalized market analysis by booking a complimentary Buyer or Seller consultation via the form below.


January 2026 Real Estate Market Report - TorontoJanuary 2026 Real Estate Market Report - MississaugaJanuary 2026 Real Estate Market Report - OakvilleJanuary 2026 Real Estate Market Report - Burlington


Do you have more questions about the market?

Fill in a few details here to get in touch.

  • This field is for validation purposes and should be left unchanged.

Toronto Real Estate Market Update For November 2025

Toronto & West GTA Real Estate Market Update – November 2025

Dec 15, 2025 | Market News

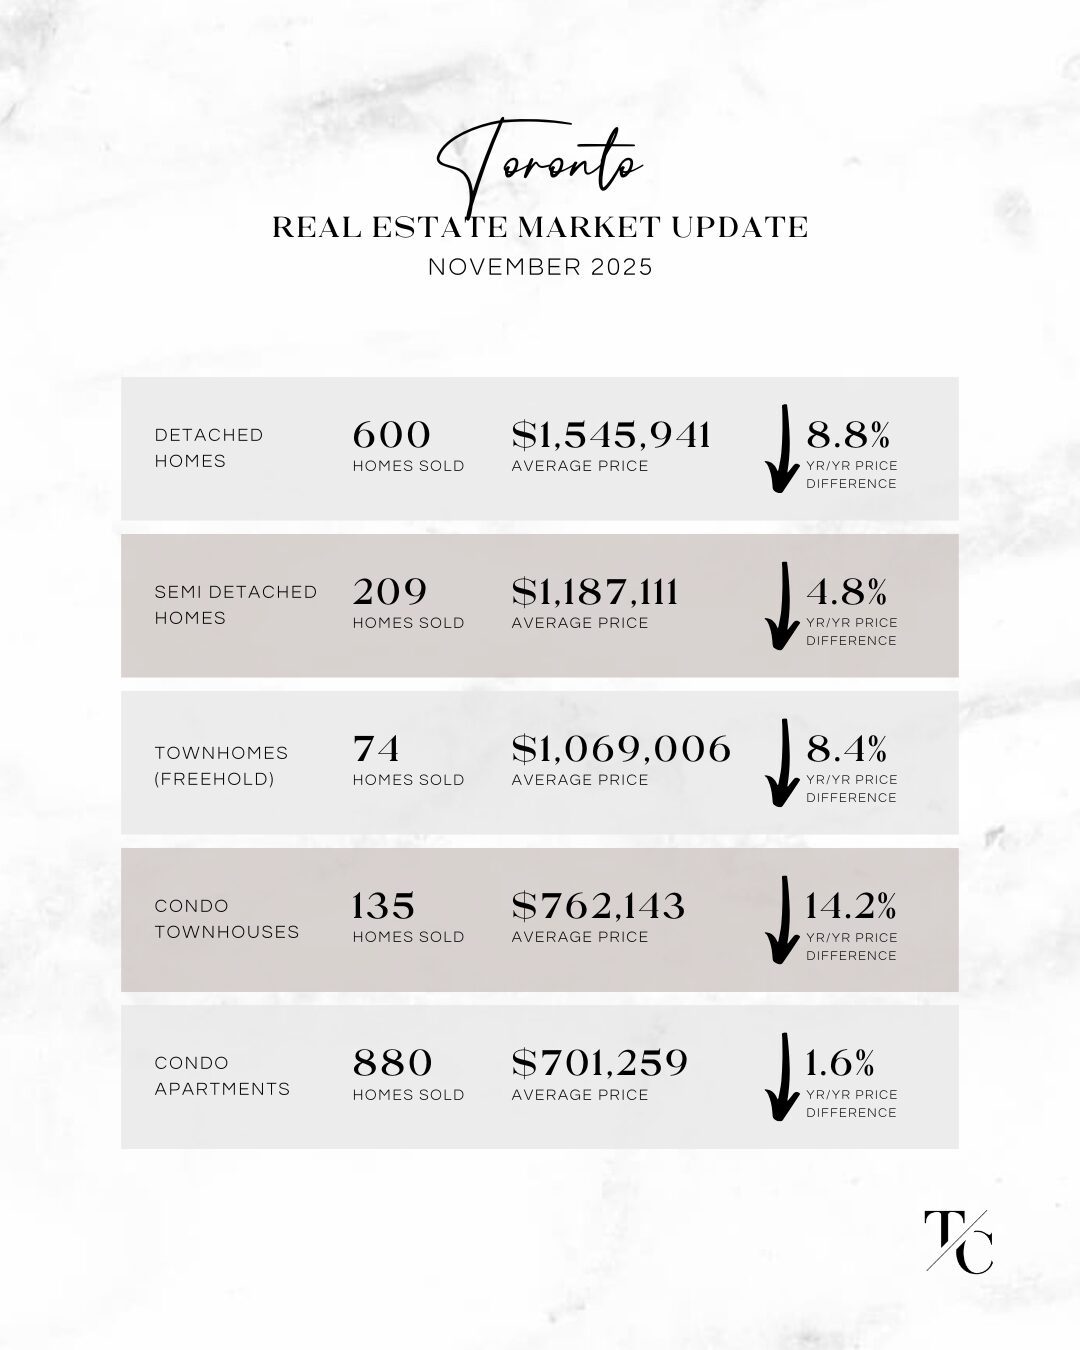
November brought a familiar theme across the Greater Toronto Area: steadier pricing alongside softer sales activity. Across Toronto, Mississauga, Oakville, and Burlington, one of the most consistent trends was a decline in sales volume across nearly all home types, reflecting continued buyer caution as the year draws to a close.

While borrowing costs have improved and resale inventory remains well supplied, many buyers continued to pause in November, weighing economic signals and long-term employment confidence. This dynamic resulted in fewer transactions month over month and year over year, even as pricing in several segments showed signs of stabilization. On a seasonally adjusted basis, both average prices and the MLS® HPI Composite remained relatively close to October levels, reinforcing the sense of a market that is holding steady rather than accelerating.

Encouragingly, stronger-than-expected employment and economic data emerged toward the end of the month, offering early signs of improving confidence. If this momentum continues, conditions may support increased buyer engagement as we move into 2026. For now, November’s activity underscores a market defined by choice, patience, and opportunity—particularly for buyers prepared to act strategically, and sellers who align pricing and presentation with current conditions.

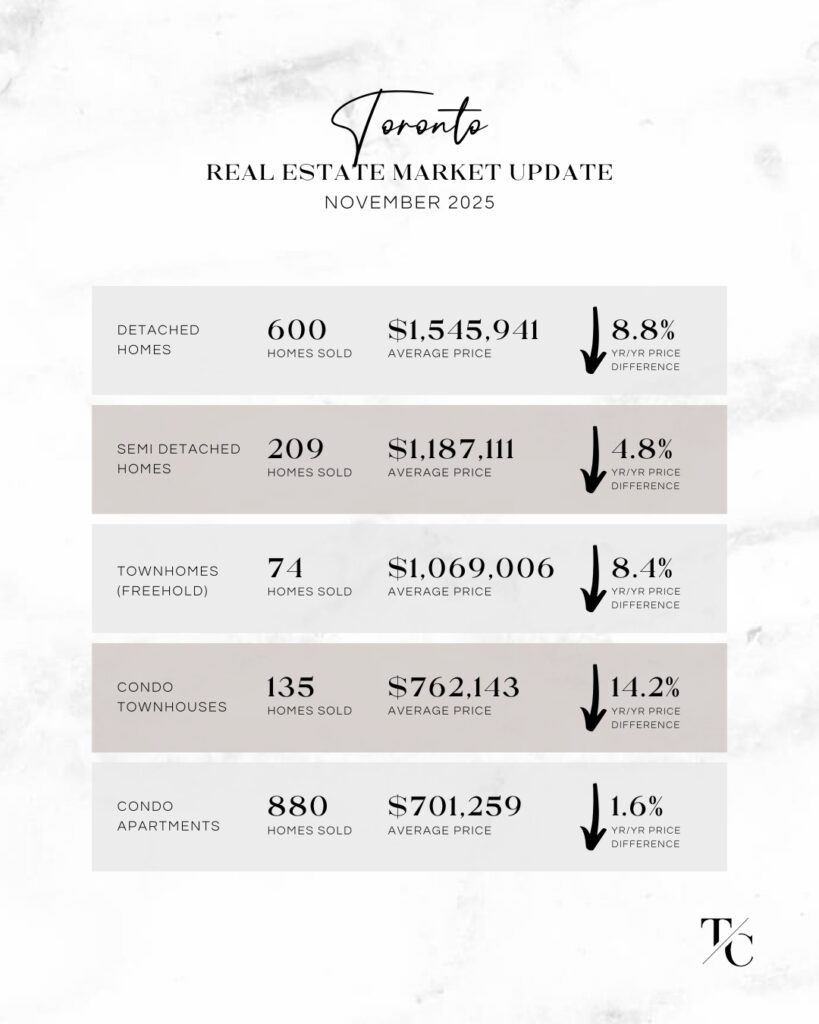
Below are our key takeaways on the month-over-month activity between October and November 2025.

◼️ Toronto average detached home price declined by $75,000 month over month. More notably, there were 147 fewer detached homes sold during the same period. Semi-detached average pricing dipped slightly by $35,000, alongside 55 fewer sales. The average price of a freehold townhouse decreased by $50,000, while sales activity increased modestly. Condo townhouse values remained flat, though fewer units sold. Condo apartment prices also held steady, with 190 fewer units sold. Keep in mind that September saw a significant increase in condo apartment sales; the softer November activity brought sales volumes back in line with August 2025, which is typically a slower month in real estate.

◼️ Mississauga average detached home prices remained essentially flat, edging up by $35,000 month over month, with 70 fewer homes sold. Among all areas in this report, Mississauga experienced the smallest year-over-year variance for detached homes, down just 2.2%. Semi-detached pricing also remained largely unchanged from the prior month, with slightly fewer sales. A similar trend was seen across freehold townhouses, condo townhouses, and condo apartments, where average prices softened marginally month over month alongside reduced sales activity, reflecting overall market conditions. On a positive note, average home values appear to have stabilized and are expected to remain relatively flat as we close out the year.

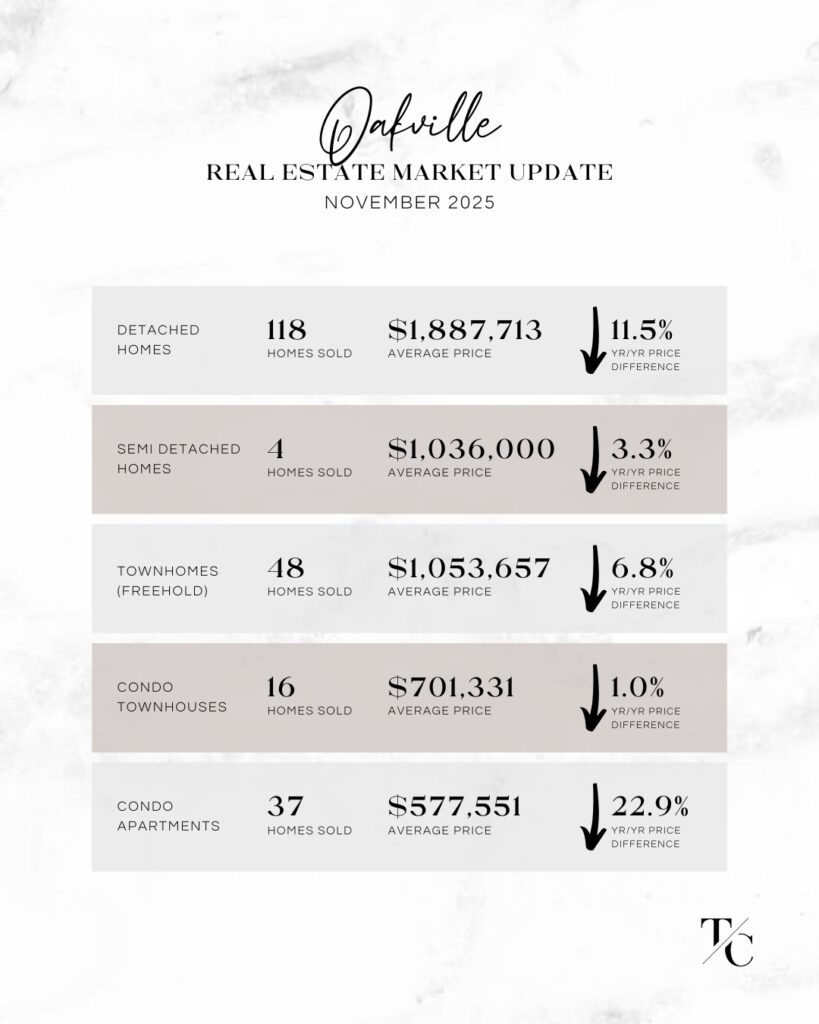
◼️ Oakville average detached home prices rose $110,000 month over month, rebounding from October’s dip in value. Sales activity remained steady, with only a modest decline of 26 fewer homes sold compared to the prior month. Year over year, the average detached home price declined by 11.5% in November, presenting a compelling opportunity for buyers looking to size up to a detached home in Oakville. Semi-detached average pricing declined by $120,000; however, only four properties sold in this category, indicating heightened price sensitivity. Freehold townhouse prices eased by $50,000 month over month, while sales volume increased. Condo townhouses experienced a notable decline in average pricing, down $100,000, with 25% fewer sales. Condo apartment pricing remained flat month over month, with a significant year-over-year decline of 23%.

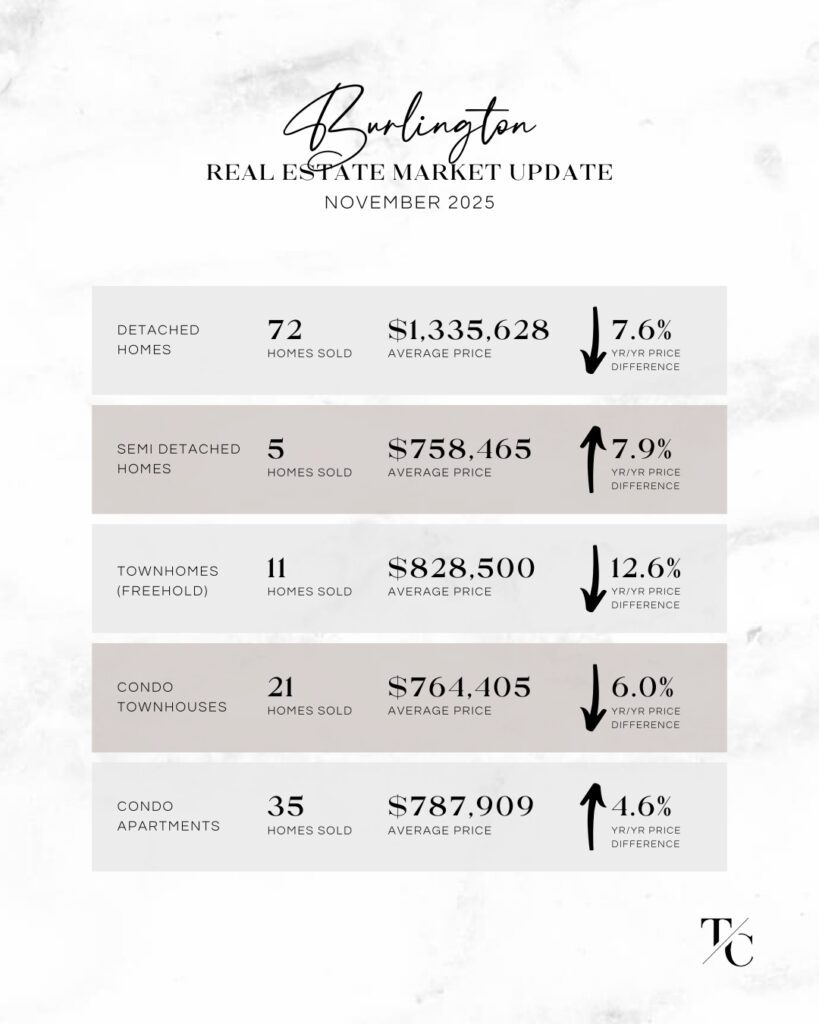
◼️ Burlington average detached home prices increased by $90,000 month over month, with 29 fewer homes sold, representing a 30% decline in sales volume. Year-over-year pricing remained consistent, reflecting an approximate 7.5% decline. Semi-detached homes saw a substantial month-over-month price decrease of $140,000, with only five homes sold; interestingly, this still represented a 7.9% increase compared to the same period last year. Freehold townhouse pricing declined by $95,000 month over month, with just 11 homes sold. Condo townhouse prices remained relatively flat, while sales volume dropped by nearly 50%. Condo apartments posted a notable increase in average price, rising $110,000 month over month and reflecting a 4.6% year-over-year gain—a welcome improvement within an otherwise challenging segment of the market.

Mississauga Real Estate Market Update For November 2025 Oakville Real Estate Market Update For November 2025 Burlington Real Estate Market Update For November 2025

Do you have questions about the market?

Fill in a few details and we'll be in touch.
  • This field is for validation purposes and should be left unchanged.

Toronto real estate market update - October 2025

Toronto & West GTA Real Estate Market Update – October 2025

Nov 24, 2025 | Market News

📣 𝐍𝐄𝐖𝐒𝐅𝐋𝐀𝐒𝐇! Here are the real estate market stats you need to know for October 2025 vs. 2024 home sales in Toronto, Mississauga, Oakville, Burlington.

October typically marks a return to stronger fall activity. Market conditions across the GTA tightened modestly, with a greater number of homes sold in nearly every area of our report, and across most home types. However, prices edged lower month over month in several freehold categories, suggesting buyers remained selective and price-sensitive despite improved engagement.

Across the board, condo apartments continued to show the highest level of transactional activity, with a noticeable jump in units both in Toronto and the 905. Freehold segments saw a lift in sales volumes as well, though average prices generally softened compared to September — a sign of increased inventory and more balanced conditions as the fall market settles.

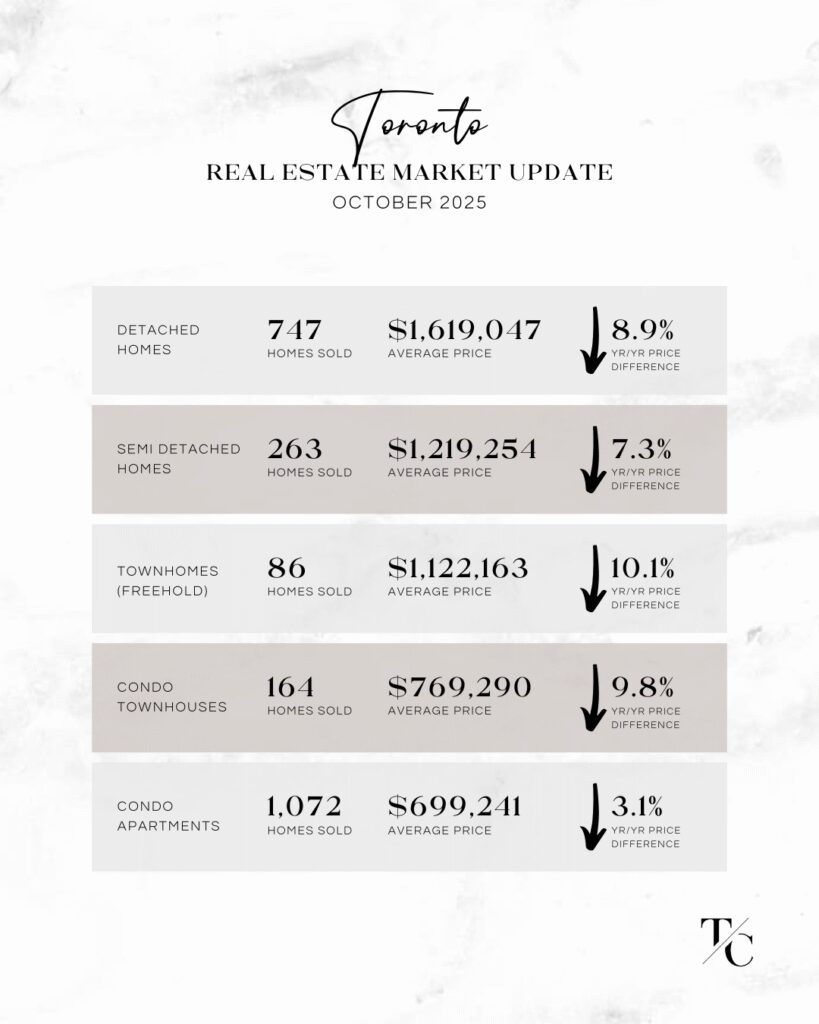
Below is a detailed breakdown of month-over-month trends between September and October 2025 and the key shifts worth noting.

◼️ Toronto sales volumes increased across all home types, although prices eased slightly in each category. Detached home values declined by $67,000 month over month and were down 9% year over year. Semi-detached homes saw increases in both sales volume and the average price, rising by $37,000 month over month, yet still down 7% year over year. Freehold townhomes saw a $52,000 decrease month over month and were down 10% over last year. Condo townhouses dipped slightly on the month and were down 10% year over year. Condo apartment sales increased meaningfully, with 132 more units sold than in September. The average price remained essentially flat month over month, though values were down 3% over last year.

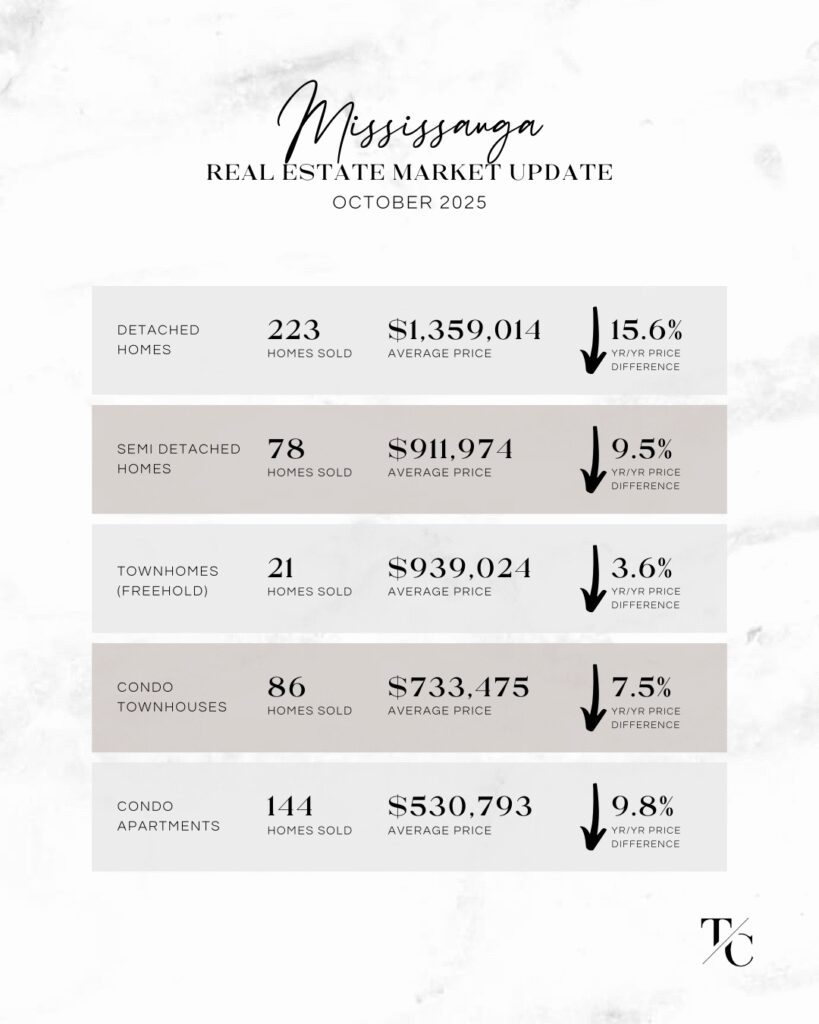
◼️ Mississauga detached home values were essentially flat month over month, with 37 more homes sold compared to September. Year over year, detached values saw a significant 15.6% decline. Semi-detached home values slipped by $46,000 month over month and were down 9.5% annually. Freehold townhomes remained flat in both sales volume and the average price, marking the smallest annual decline among Mississauga’s freehold segments at 3.6%. Condo townhouse values dipped slightly from September and were down 7.5% year over year. Condo apartment sales increased modestly, though the average price decreased by $32,000 month over month and was down 10% annually.

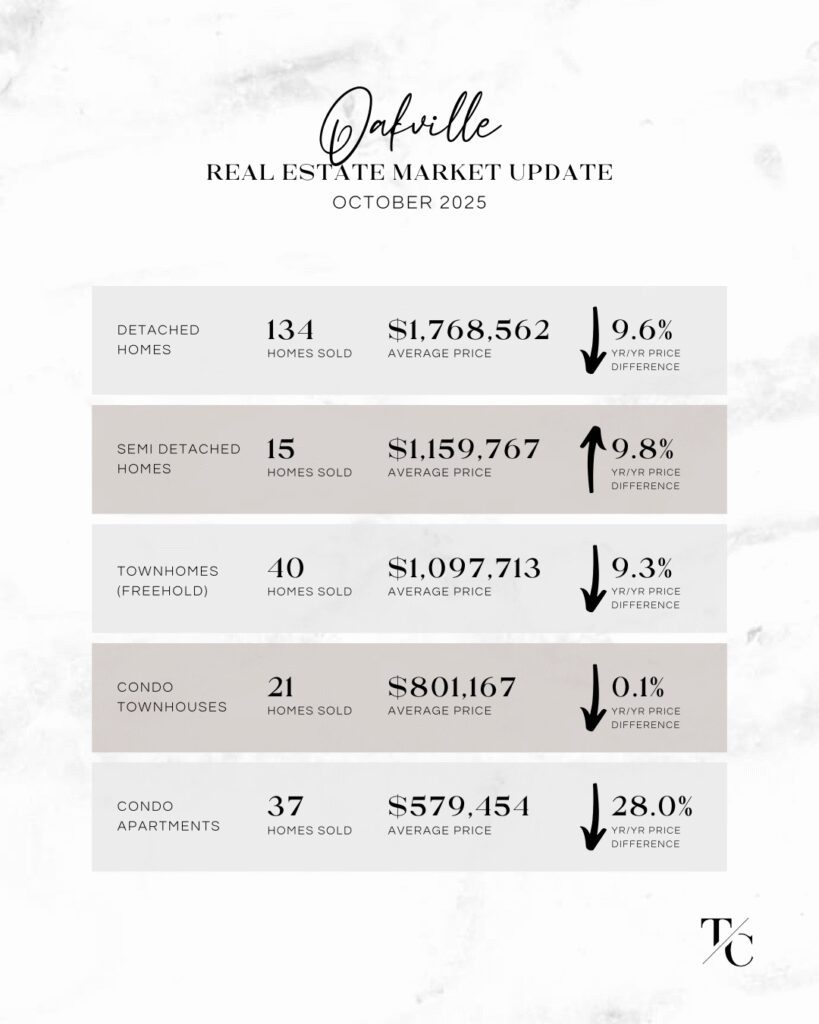
◼️ Oakville detached homes recorded the steepest month-over-month price decline, presenting opportunities for buyers as the average price fell below $1.8M. Detached values were down $82,000 month over month and 9.6% year over year. Semi-detached homes held relatively steady with only a slight decrease month over month and were the only home type to show an annual increase, rising nearly 10% over last year. Freehold townhomes remained flat month over month and were down 9% year over year. Condo townhouses experienced a significant month-over-month decrease, dropping $120,000, yet remained flat year over year. Condo apartments also saw a $100,000 decline month over month, with a substantial 28% annual decrease — creating exceptional opportunities for condo buyers in Oakville.

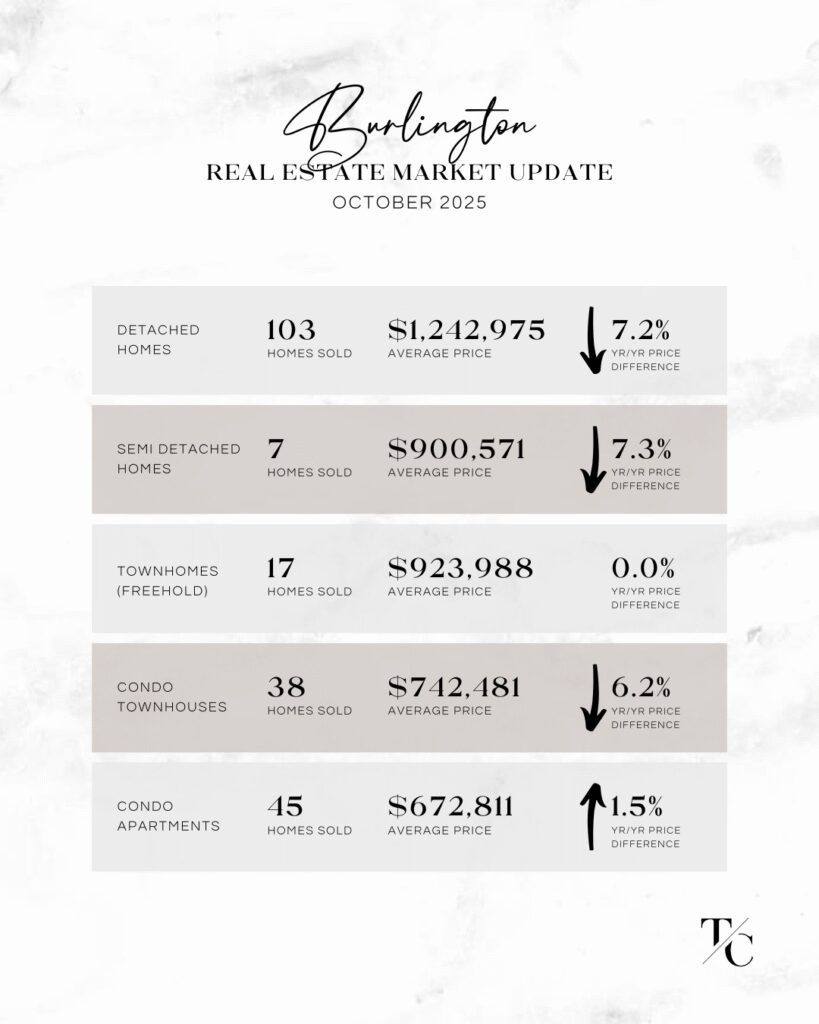
◼️ Burlington detached home values dipped slightly, down $50,000 month over month and 7.2% year over year. Fewer detached homes sold in Burlington than in any other area in this report. Semi-detached homes were down $50,000 month over month and 7.4% annually. Freehold townhomes increased by $30,000 and were flat year over year. Condo townhouses were essentially flat month over month, supported by a higher sales volume, and were down 6.2% year over year. Condo apartment values were flat month over month however with more units sold. The average condo apartment value was up slightly over last year, up by 1.5%— making Burlington one of the few markets to show annual gains in the condo apartment segment.

𝘞𝘢𝘯𝘵 𝘵𝘰 𝘬𝘯𝘰𝘸 𝘸𝘩𝘢𝘵’𝘴 𝘩𝘢𝘱𝘱𝘦𝘯𝘪𝘯𝘨 𝘪𝘯 𝘺𝘰𝘶𝘳 𝘯𝘦𝘪𝘨𝘩𝘣𝘰𝘶𝘳𝘩𝘰𝘰𝘥? Obtain a personalized market analysis by booking a complimentary Buyer or Seller consultation with us via the form below.

Toronto real estate market update - October 2025Mississauga real estate market update - October 2025Oakville real estate market update - October 2025Burlington real estate market update - October 2025

Do you have questions about the market?

Fill out a few quick details to get in touch.
  • This field is for validation purposes and should be left unchanged.

Toronto Real Estate Market Update - September 2025

Toronto & West GTA Real Estate Market Update – September 2025

Oct 24, 2025 | Market News

📣 NEWSFLASH! Here are the real estate market stats you need to know for September 2025 vs. 2024 home sales in Toronto, Mississauga, Oakville, and Burlington.

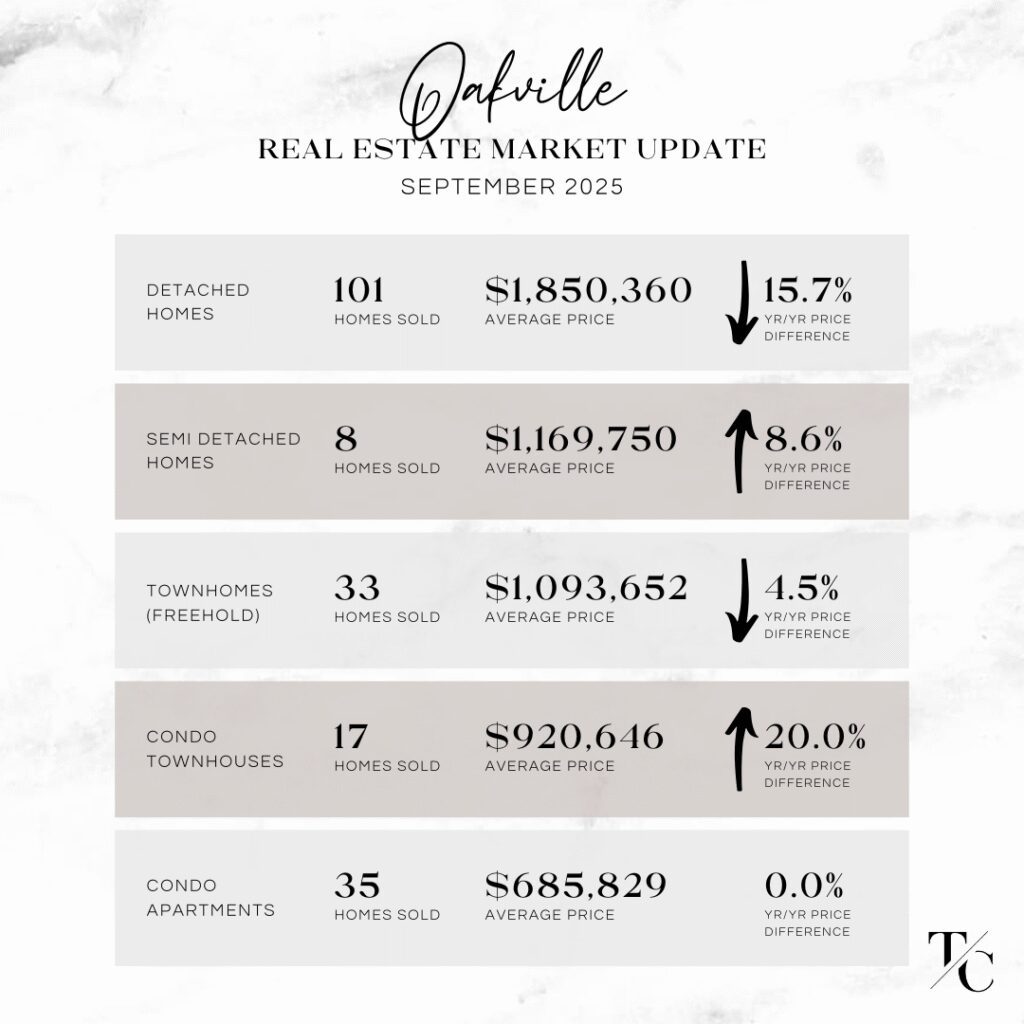
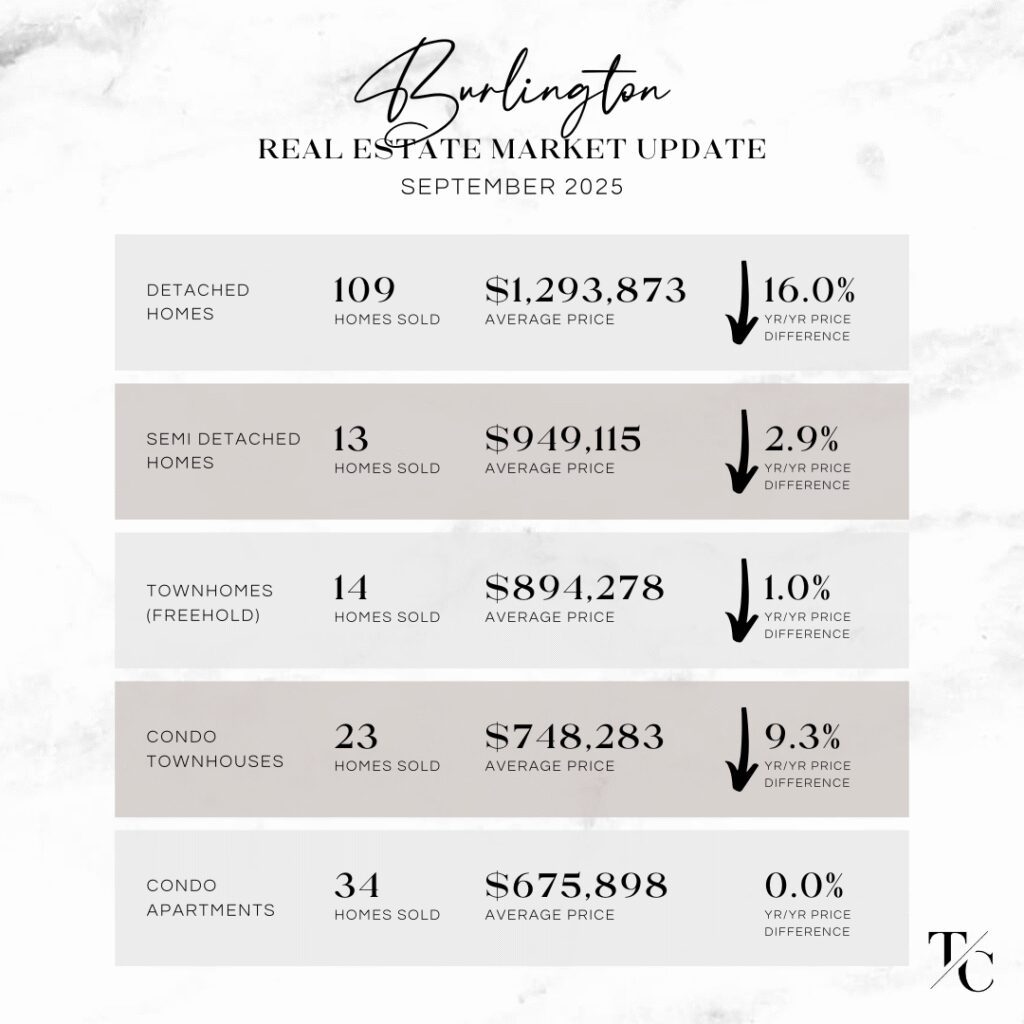
Across the Toronto Regional Real Estate Board areas in our report, pricing continued to trend lower year over year in most categories, with a few bright spots: Toronto detached home values held even with last year, Oakville semis and condo townhomes advanced annually, and Burlington condo apartments matched last year’s average. On a month-over-month (August to September 2025), activity re-accelerated in Toronto and Mississauga — while Oakville and Burlington saw mixed results. Seasonality is giving way to fall momentum in the 416 and Mississauga, while buyers remain price-sensitive across Halton.

Here’s the month-over-month story from August → September 2025:

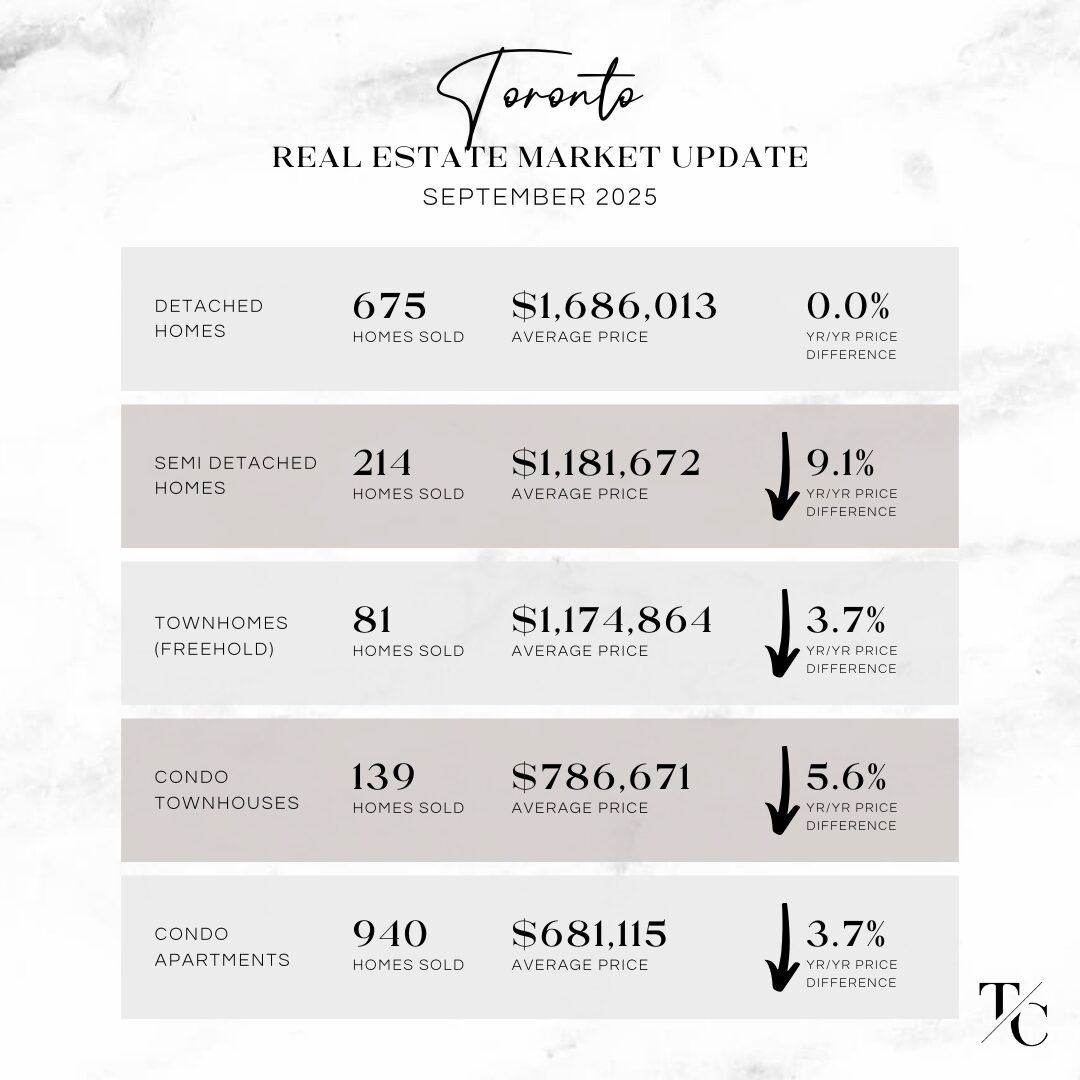
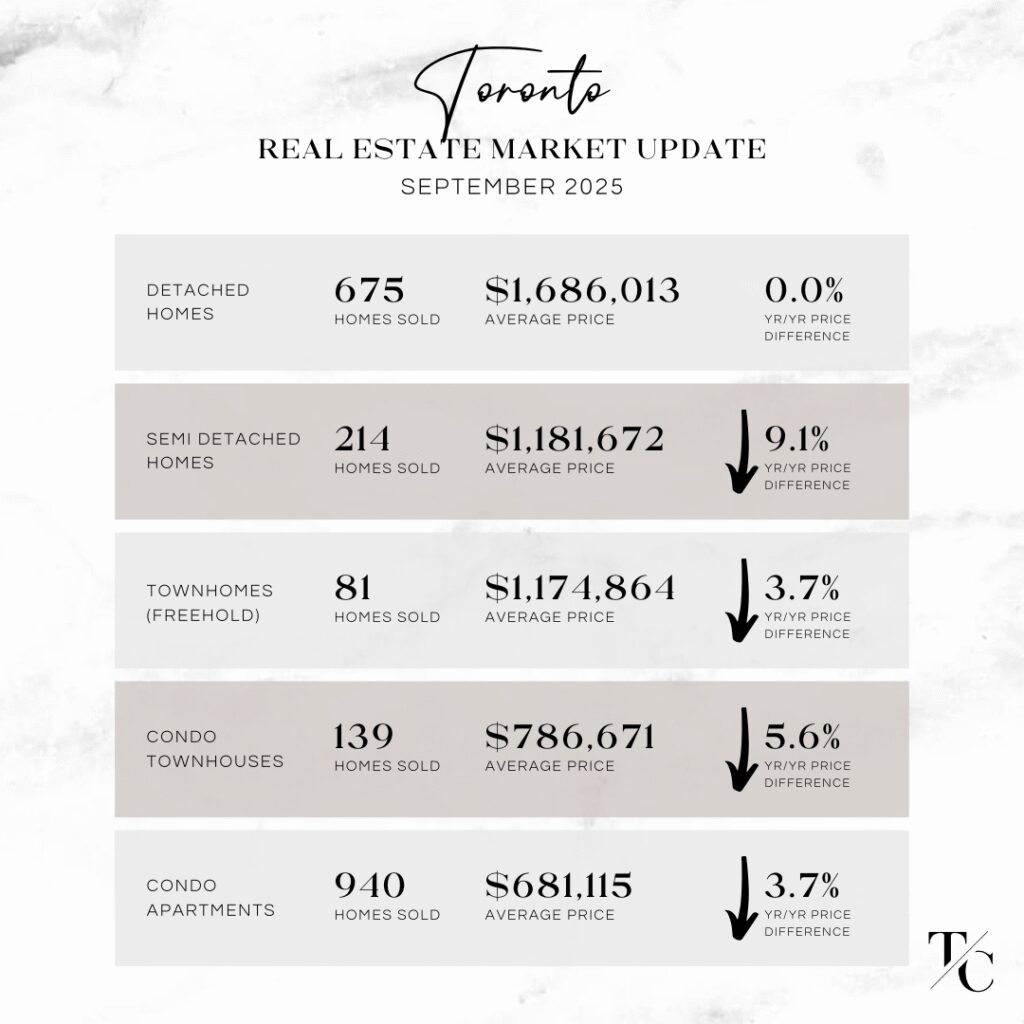
◼️ Toronto – Average prices climbed across every property type with an increase in sales volume, signalling a more energized fall start. Toronto average detached home values up $160,000 month over month, while flat to last year. Semi-detached home values up $50,000 month over month, yet down 9% over last year. Freehold townhomes up $43,000 month over month, down almost 4% over last year. Condo towns essentially flat on the month over month, down over last year. Condo apartments edging up slightly on the month over month, yet down close to 4% over last year.

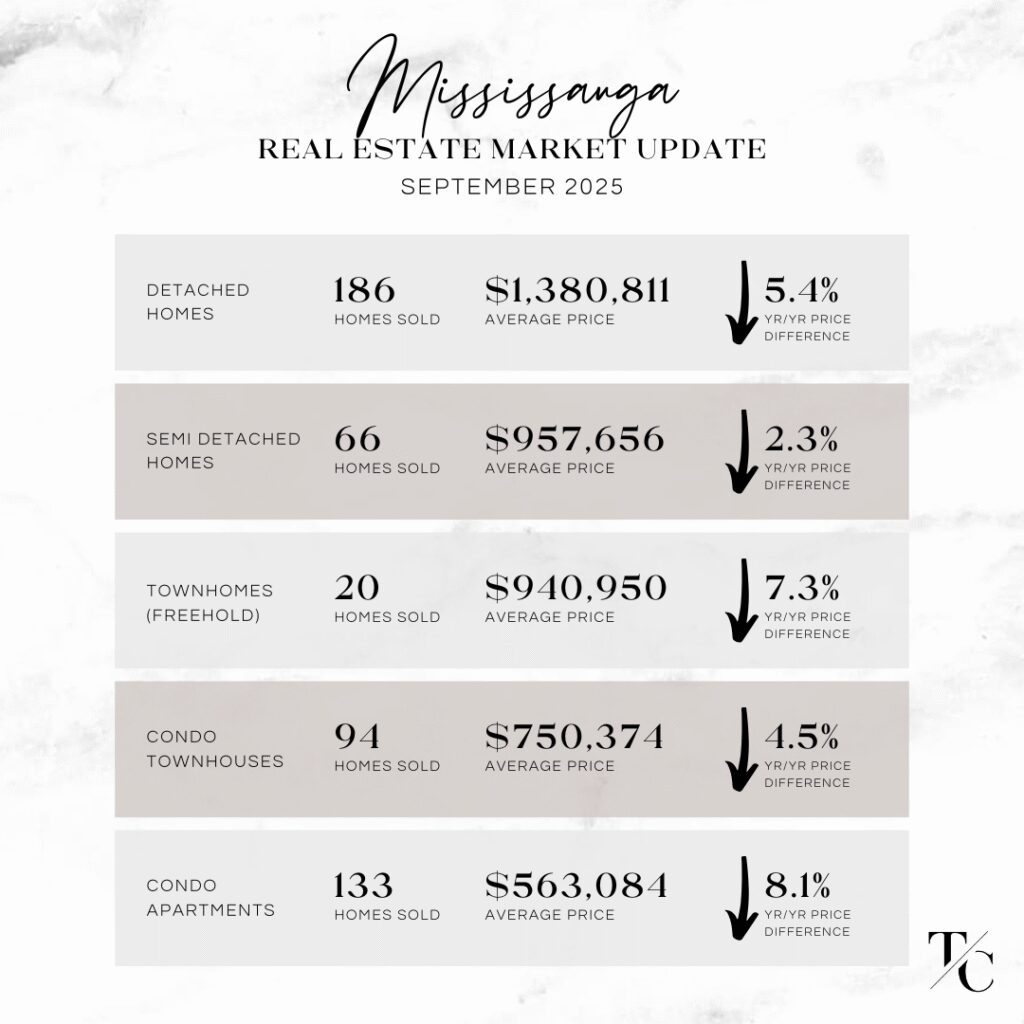
◼️ Mississauga – Momentum improved with a greater number of homes sold, however modest price growth in most segments. Notable opportunity to buy a freehold semi or townhouse here with the average price hovering in the mid $900s – making it an opportune category for first time homebuyers.

Mississauga’s average detached home values essentially flat on the month over month, down 5.5% year over year. Semi-detached home values down $16,000 month over month with the average price just north of $950,000 and down just over 2% from last year. Freehold townhouses home values. down almost $25,000 month over month and down over 7% from last year Condo towns held stead, yet down 4.5% over last year. Condo apartments slightly up over the month prior, yet down 8% to last year.

◼️ Oakville – interesting results here with fewer homes sold across most categories as compared to the month prior. Considerable dip in the average detached home values, down close to $50,000 over the month prior however down almost 16% over last year. Semi-detached saw a standout gain, up almost $150,000 over the month prior and up 8.6% over last year. Freehold towns down slightly month over month, and down 4.5% over last year. Condos towns up $55,000 on the month over month and a massive 20% gain year over year. Condo apartments saw an $80,000 drop over the month prior yet flat year over year.

◼️ Burlington detached home values dropped $106,000 month the month over month, down 16% year over year – the biggest drop by home type in Burlington. There was a period of time where Burlington detached home values were at par with Mississauga, however we’re seeing that smaller price-point detached homes are transacting in Burlington, in a sub $900k price point, contributing to a drop in the average detached home price which was just under $1.3m in September. Semi-detached homes were up $39,000 month over month and down just under 3% over last year. Freehold townhouses down close to $25,000 month over month and essentially flat over last year. Condo towns steady month over month yet were down 9.3% year over year. Condo apartments rebound, up $79,000 month over month and flat over last year.

𝘞𝘢𝘯𝘵 𝘵𝘰 𝘬𝘯𝘰𝘸 𝘸𝘩𝘢𝘵’𝘴 𝘩𝘢𝘱𝘱𝘦𝘯𝘪𝘯𝘨 𝘪𝘯 𝘺𝘰𝘶𝘳 𝘯𝘦𝘪𝘨𝘩𝘣𝘰𝘶𝘳𝘩𝘰𝘰𝘥? Obtain a personalized market analysis by booking a complimentary Buyer or Seller consultation with us via the form below.


Toronto Real Estate Market Update - September 2025Mississauga Real Estate Market Update - September 2025Oakville Real Estate Market Update - September 2025Burlington Real Estate Market Update - September 2025

Curious about the market?

Get in touch today for more insights.

  • This field is for validation purposes and should be left unchanged.

Toronto Real Estate Market Update August 2025

Toronto & West GTA Real Estate Market Update – August 2025

Sep 25, 2025 | Market News

📣 𝐍𝐄𝐖𝐒𝐅𝐋𝐀𝐒𝐇! Here are the real estate market stats you need to know for August 2025 vs. 2024 home sales in Toronto, Mississauga, Oakville, Burlington.

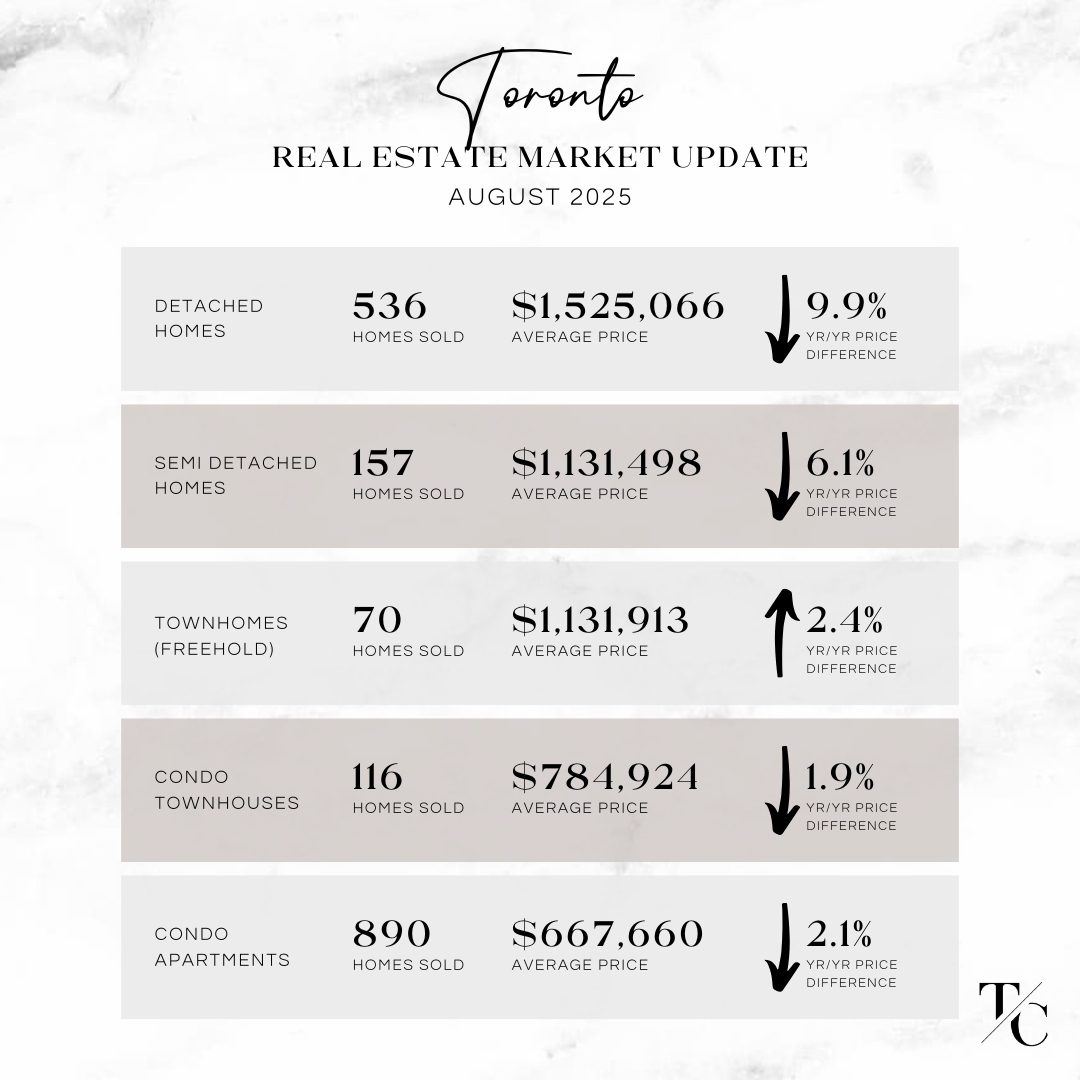
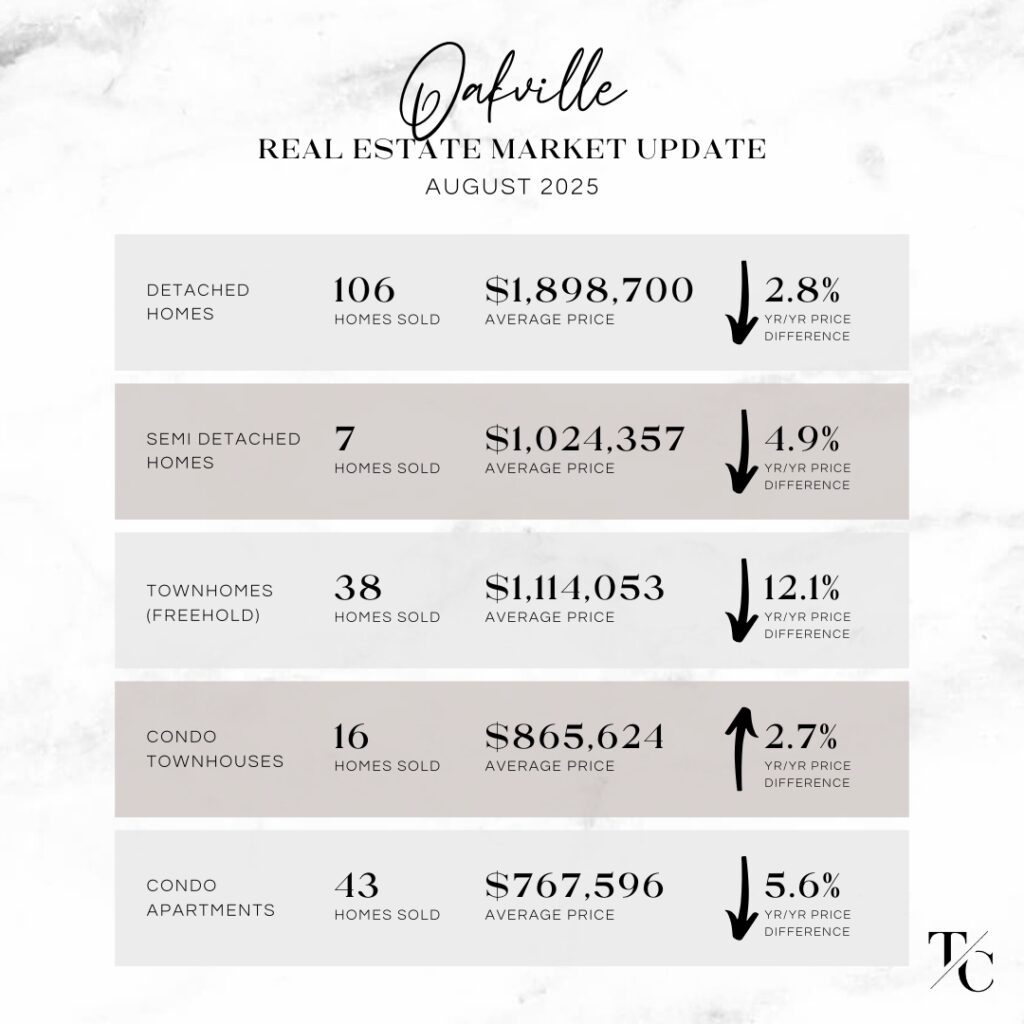
Home sales were up slightly compared to 2024 according to Toronto Regional Real Estate Board stats, although the pace of transactions lagged well behind supply — with four times more new listings than sales. From July to August 2025, fewer homes sold across nearly every property type, reflecting the seasonal slowdown that typically comes with August. Overall, prices held steady compared to the month prior, while year-over-year values remain lower across all the areas in our report. Among all home types, detached homes continue to show the most resilience.

𝗛𝗲𝗿𝗲 𝗮𝗿𝗲 𝗼𝘂𝗿 𝗸𝗲𝘆 𝘁𝗮𝗸𝗲𝗮𝘄𝗮𝘆𝘀 𝗼𝗻 𝘁𝗵𝗲 𝗺𝗼𝗻𝘁𝗵 𝗼𝘃𝗲𝗿 𝗺𝗼𝗻𝘁𝗵 𝗮𝗰𝘁𝗶𝘃𝗶𝘁𝘆 𝗯𝗲𝘁𝘄𝗲𝗲𝗻 𝗝𝘂𝗹𝘆 𝗮𝗻𝗱 𝗔𝘂𝗴𝘂𝘀𝘁 𝟮𝟬𝟮𝟱:

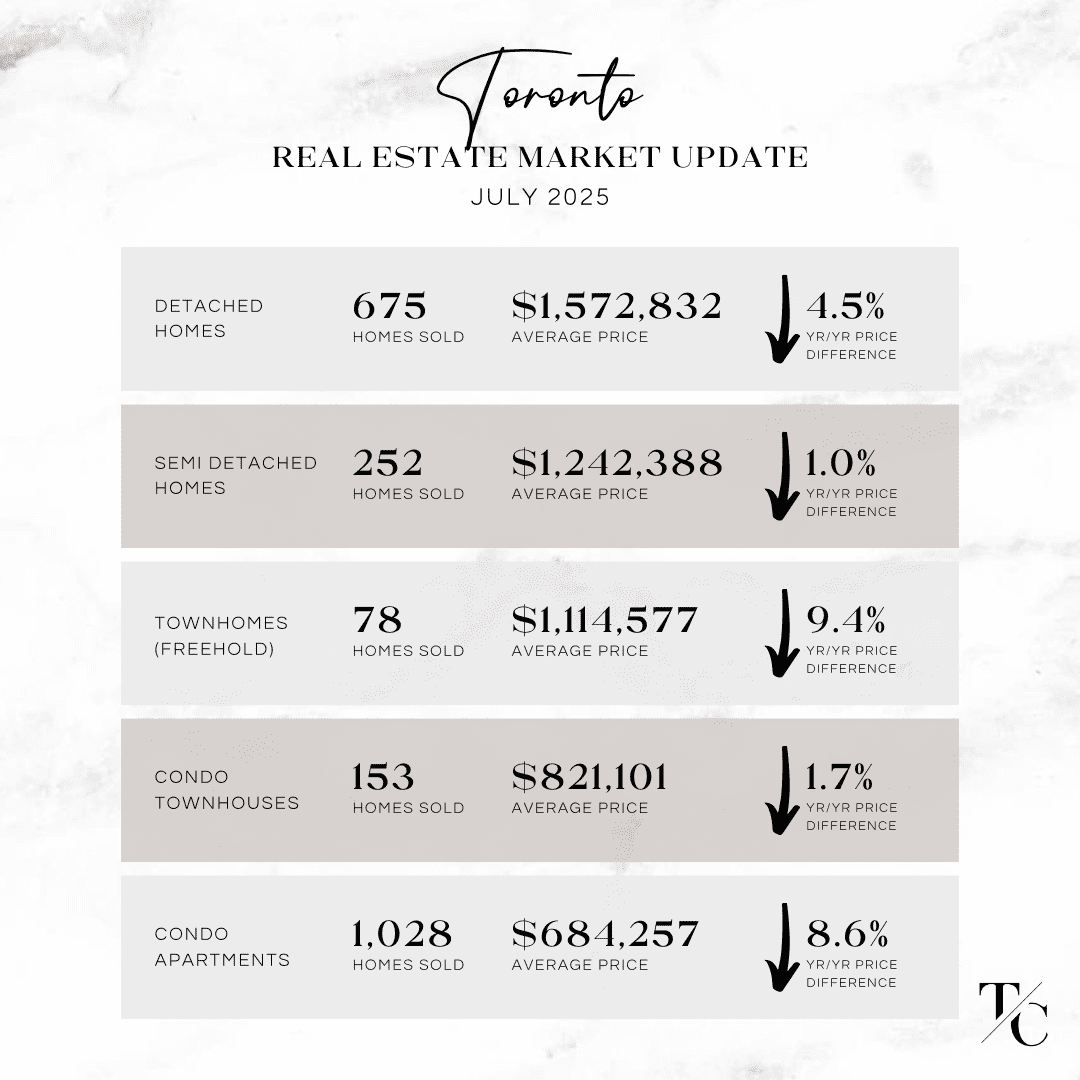
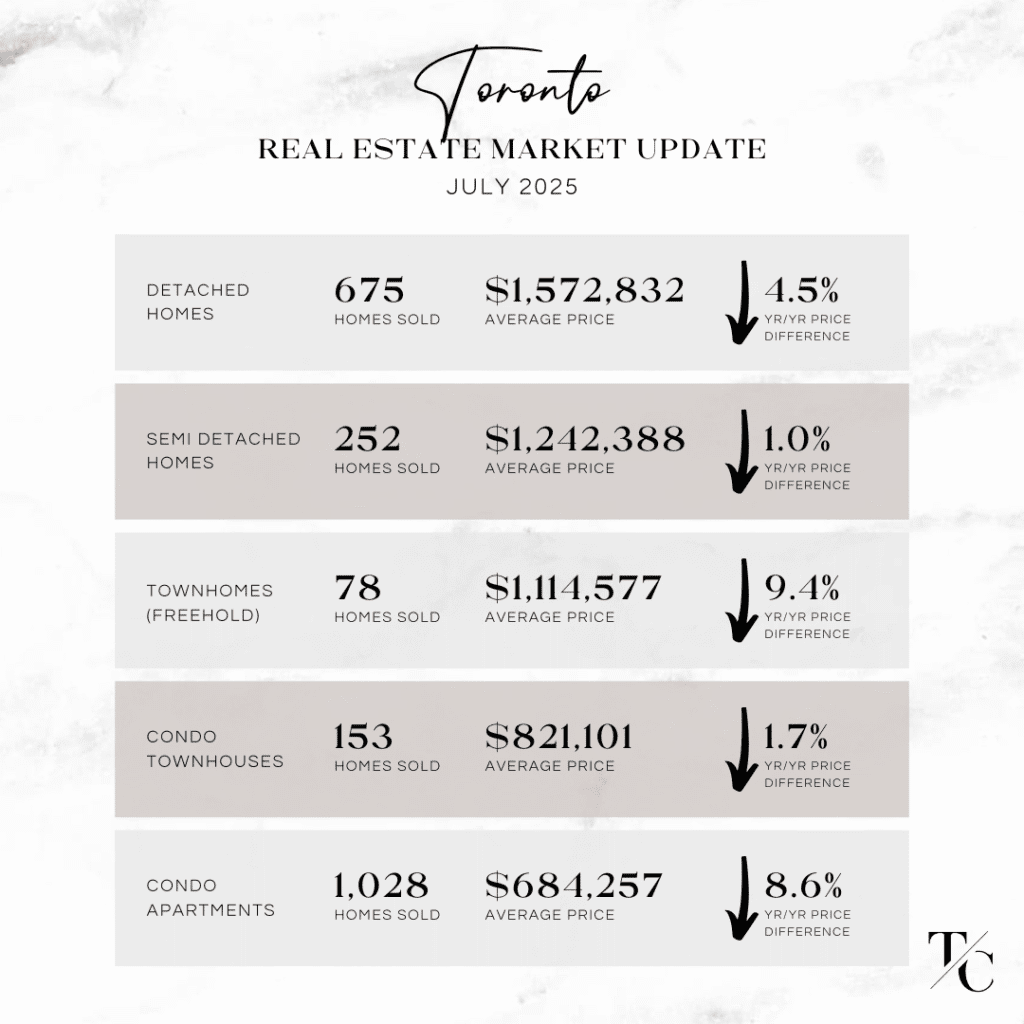
◼️ Toronto’s average detached home values fell nearly 10% year over year with a slight month-over-month dip, semi-detached values dropped $90K from last month and with almost 100 fewer sales. Freehold townhomes were the only category up year over year yet flat month to month (though notably down 11% year over year and $100K month over month), condo townhomes dipped slightly, and condo apartments remained flat with 138 fewer units sold.

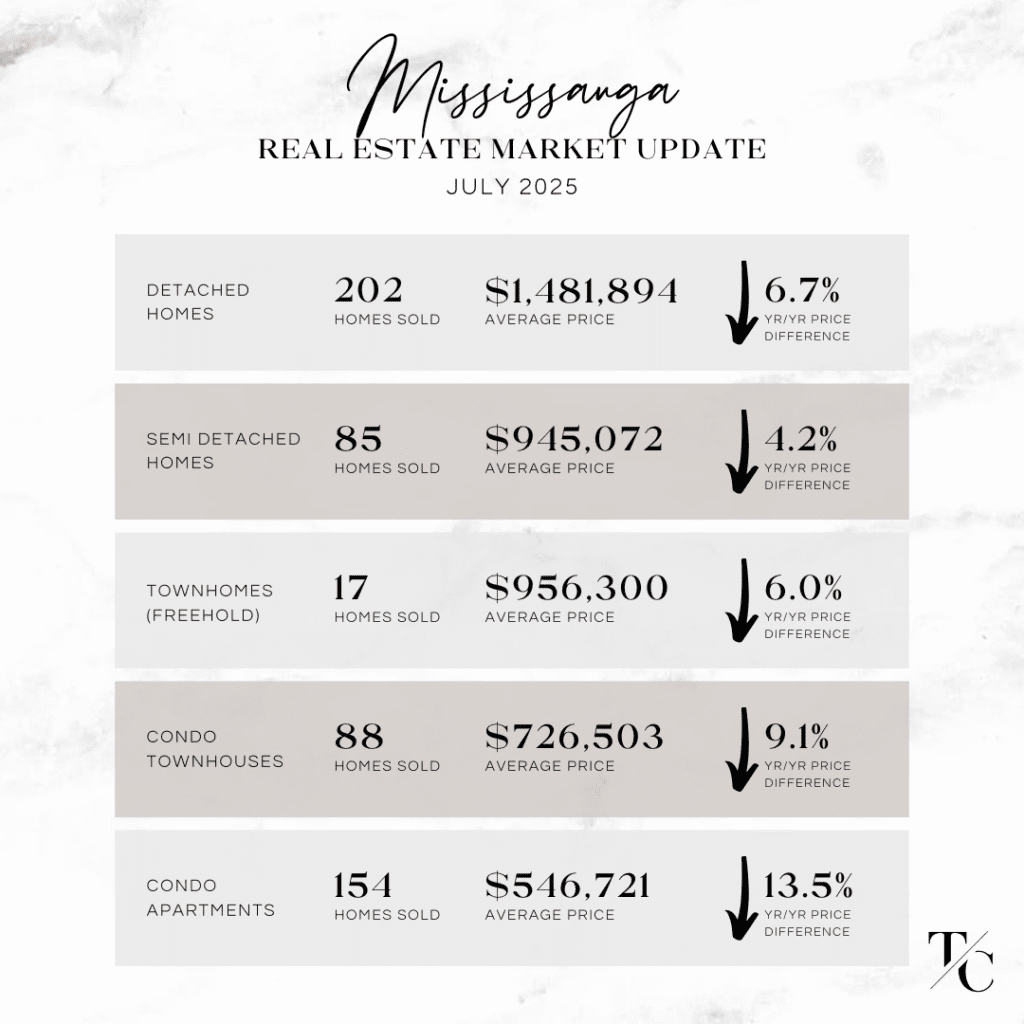
◼️ Mississauga’s average detached home values fell 6.7% year over year and $120,000 month over month, while semi-detached homes, condo townhomes, and condo apartments held steady; sales volumes declined across all housing types except freehold townhomes, which remained consistent.

◼️ Oakville’s average detached home values saw the smallest year-over-year decline at 2.8%, though down $100,000 month over month; semi-detached values held steady, while freehold townhomes, condo townhomes, and condo apartments saw month-over-month gains on the average price and with overall sales volumes steady across all home types except detached, which had 14 fewer sales.

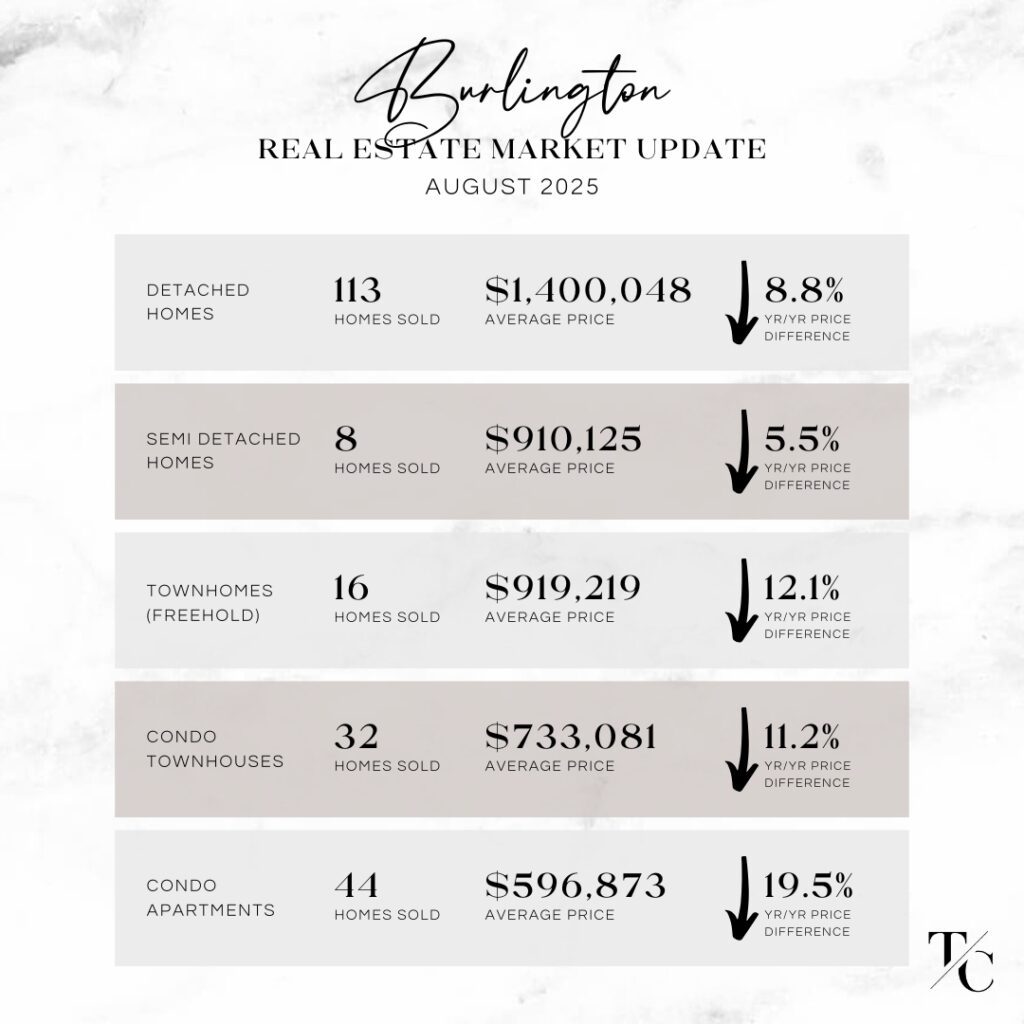
◼️ Burlington detached home values held steady month over month yet were down 8.8% year over year. All remaining home types were flat month over month but saw double-digit annual declines, including freehold townhomes, condo townhomes, and condo apartments. Condo apartments were down a striking 19.5% year over year — the largest decline by category across the areas in our report.

𝘞𝘢𝘯𝘵 𝘵𝘰 𝘬𝘯𝘰𝘸 𝘸𝘩𝘢𝘵’𝘴 𝘩𝘢𝘱𝘱𝘦𝘯𝘪𝘯𝘨 𝘪𝘯 𝘺𝘰𝘶𝘳 𝘯𝘦𝘪𝘨𝘩𝘣𝘰𝘶𝘳𝘩𝘰𝘰𝘥? Obtain a personalized market analysis by booking a complimentary Buyer or Seller consultation with us via the form below.

Toronto Real Estate Market Update August 2025Mississauga Real Estate Market Update August 2025Oakville Real Estate Market Update August 2025Burlington Real Estate Market Update August 2025

Get in touch

Fill out a few details and we will reach out to you

  • This field is for validation purposes and should be left unchanged.

Toronto Real Estate Market Update - July 2025

Toronto & West GTA Real Estate Market Update – July 2025

Aug 28, 2025 | Market News

Toronto Real Estate Market Update - July 2025Mississauga Real Estate Market Update - July 2025Oakville Real Estate Market Update - July 2025Burlington Real Estate Market Update - July 2025

Do you have questions about the market?

Get in touch with us here.

  • This field is for validation purposes and should be left unchanged.

Toronto & West GTA Real Estate Market Update – June 2025

Jul 23, 2025 | Market News

📣 𝐍𝐄𝐖𝐒𝐅𝐋𝐀𝐒𝐇! Here are the real estate market stats you need to know for June 2025 vs. 2024 home sales in Toronto, Mississauga, Oakville, Burlington.

Fewer homes were sold in June compared to the same time in 2024, while new listings were up nearly 8% year over year across TRREB regions. Buyer’s market conditions continue across most areas of the GTA, creating an opportune time for purchasers across home types.

📝 𝗛𝗲𝗿𝗲 𝗮𝗿𝗲 𝗼𝘂𝗿 𝗸𝗲𝘆 𝘁𝗮𝗸𝗲𝗮𝘄𝗮𝘆𝘀 𝗼𝗻 𝘁𝗵𝗲 𝗺𝗼𝗻𝘁𝗵 𝗼𝘃𝗲𝗿 𝗺𝗼𝗻𝘁𝗵 𝗮𝗰𝘁𝗶𝘃𝗶𝘁𝘆 𝗯𝗲𝘁𝘄𝗲𝗲𝗻 𝗠𝗮𝘆 𝗮𝗻𝗱 𝗝𝘂𝗻𝗲 𝟮𝟬𝟮𝟱:

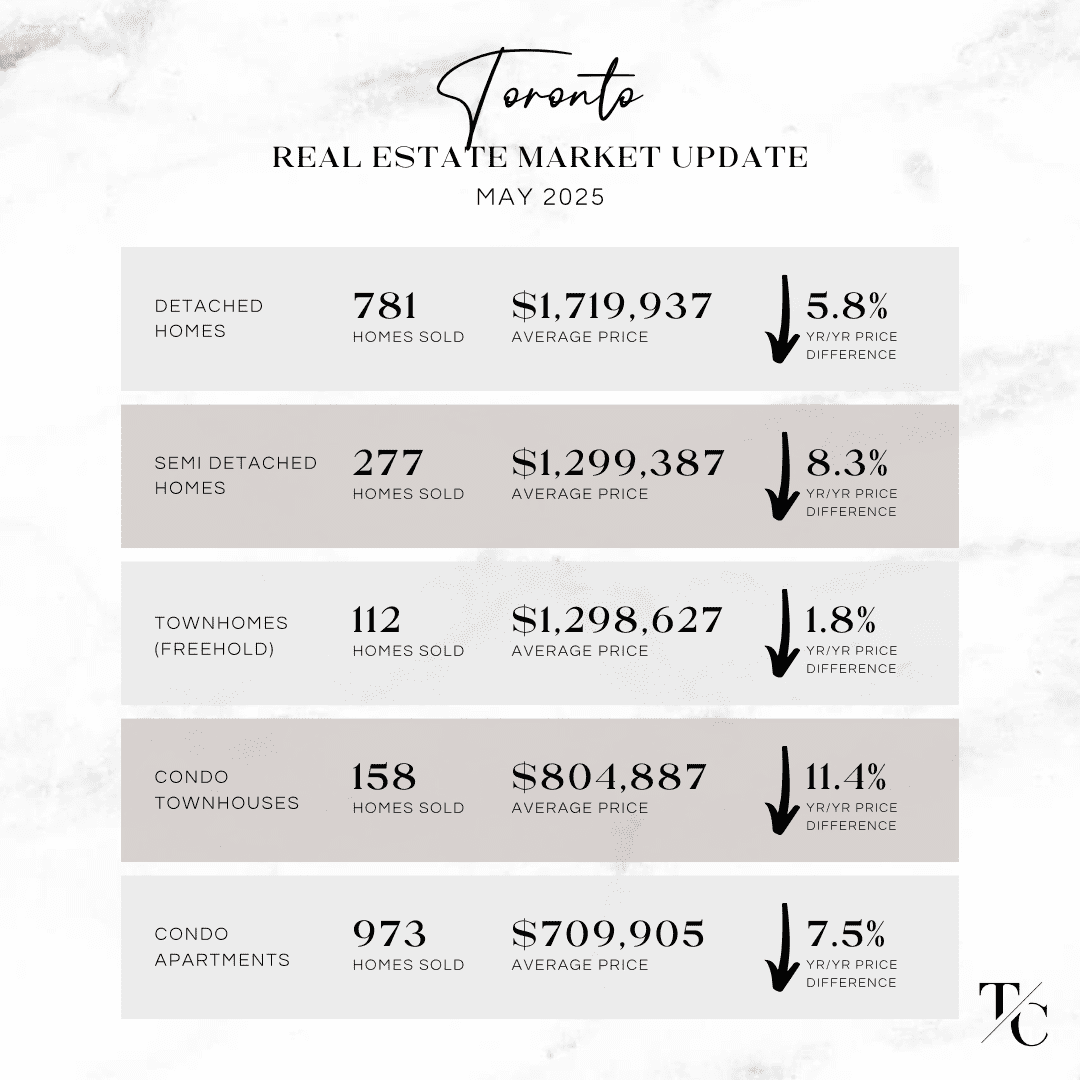
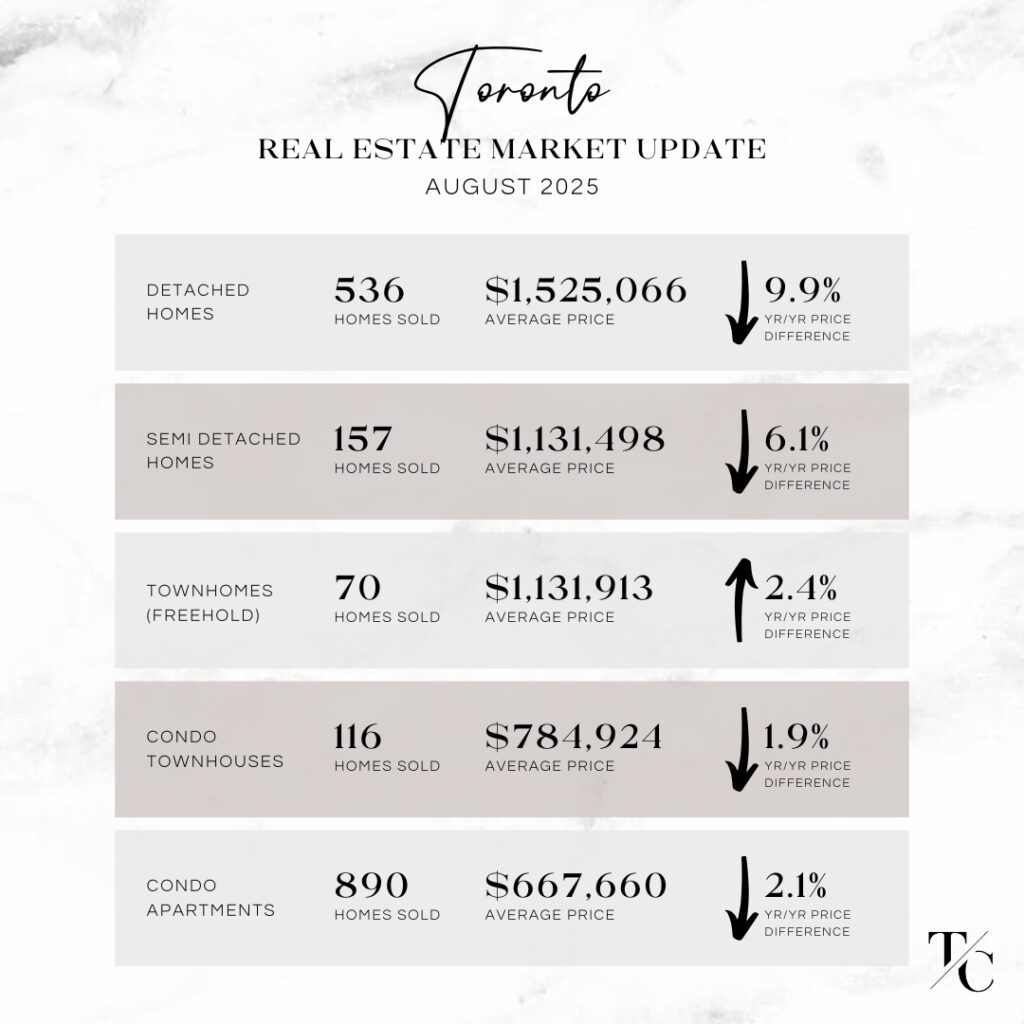
◼️ Toronto’s average detached home values were down 6.6% compared to last year, consistent with the average percentage drop over the past three months (as compared to 2024), and down $60,000 month over month. Semi-detached homes, condo towns, and condo apartments remained flat from the month prior. The most significant dip was in freehold towns, down 11% year over year and $100,000 month over month.
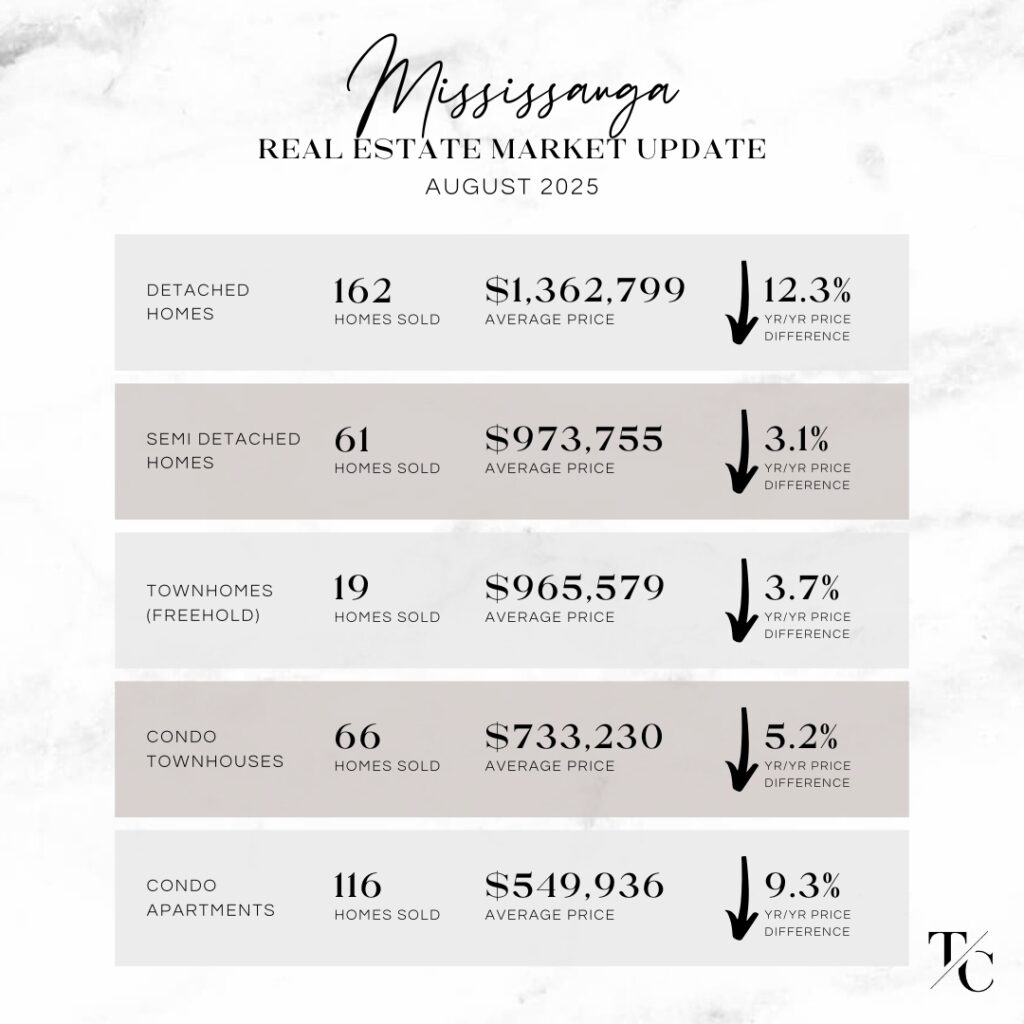
◼️ Mississauga’s average detached home value was down 7.1% compared to last year, while remaining flat month over month. Semi-detached homes, condo towns, and condo apartments also held steady from the month prior. Ironically, like Toronto, freehold towns were the only category with a notable month-over-month decline—down $70,000—and down 8.9% year over year.

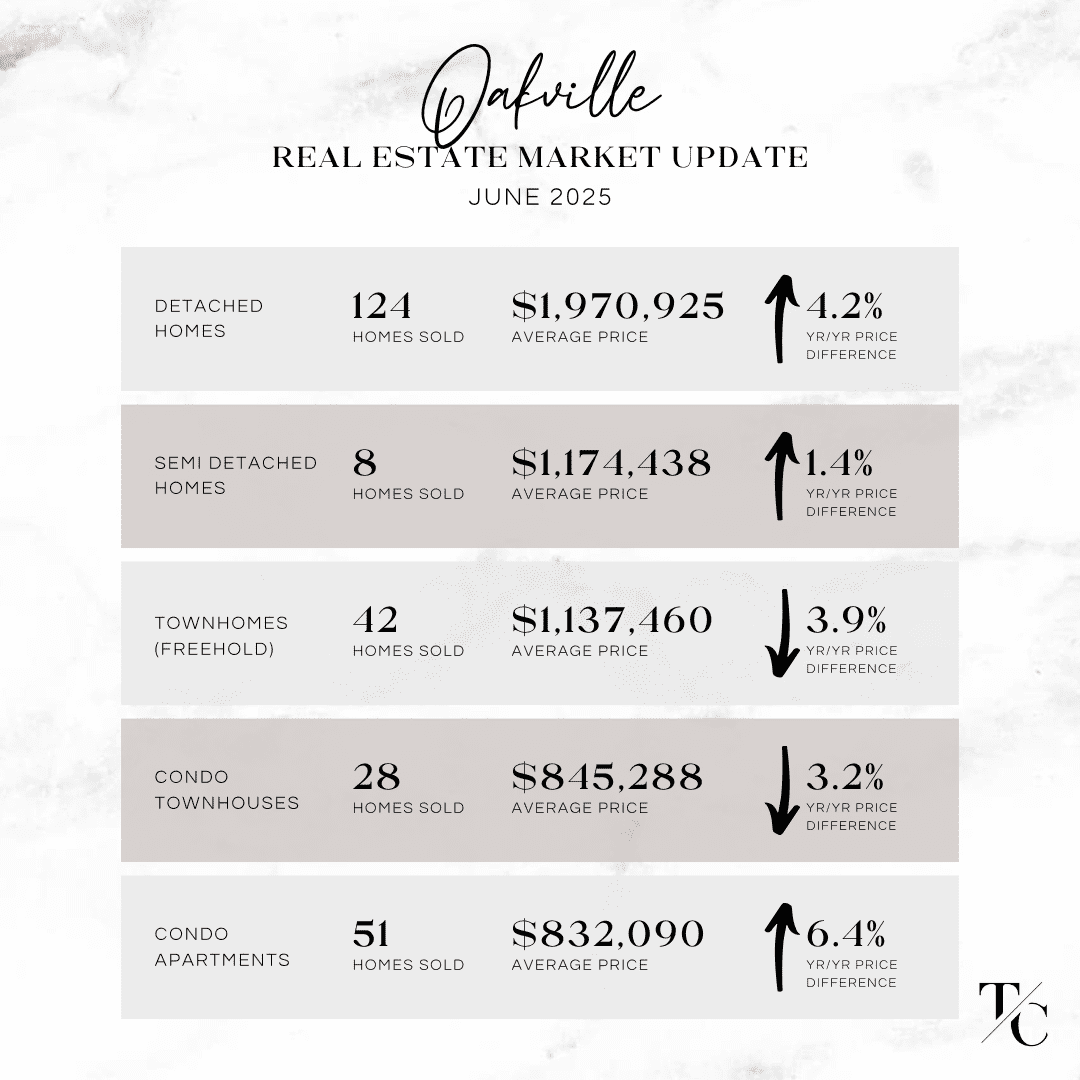
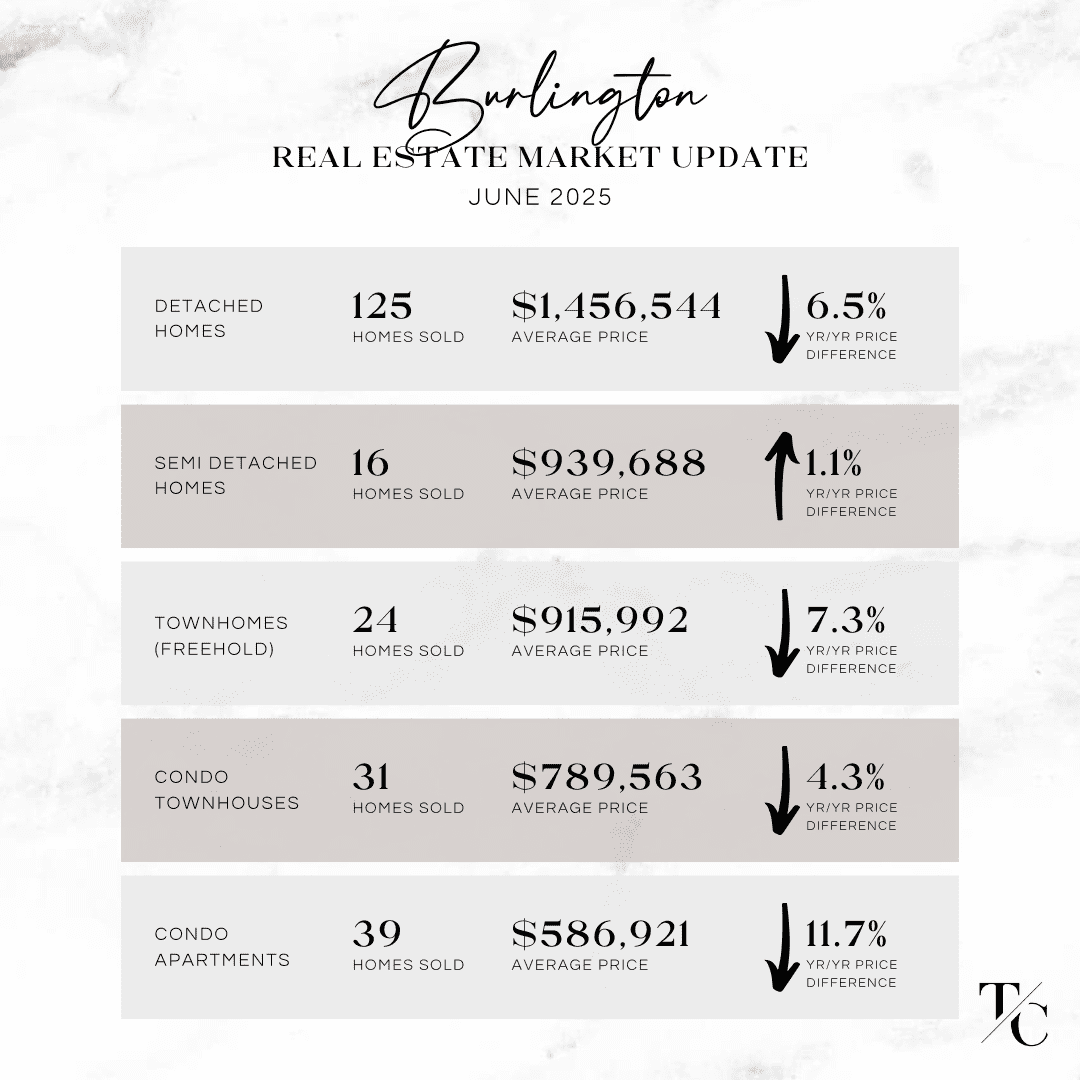
◼️ Oakville was the only area in our report where average detached home values were up over last year, showing a 4.2% increase, with prices also slightly up from the month prior. Semi-detached home values were up slightly year over year, while the average price rose $75,000 month over month. Freehold townhouses and condo apartments were flat compared to last month (though condo apartment prices were up year over year — great to see in the condo sector). Condo townhouses were down year over year but up $50,000 month over month.

◼️ Burlington detached home values are up $100,000 from the month prior, which is good news after three months of downward trends. Still, the average detached home price in Burlington is down 6.5% compared to last year, a slightly larger drop than in Mississauga or Toronto. Semi-detached homes rose month over month by nearly $80,000. Freehold towns and condo towns are both down year over year and flat month over month. Condo apartments saw a sharp decline from May, down $140,000, marking the largest year-over-year category drop at nearly 12%.

𝘞𝘢𝘯𝘵 𝘵𝘰 𝘬𝘯𝘰𝘸 𝘸𝘩𝘢𝘵’𝘴 𝘩𝘢𝘱𝘱𝘦𝘯𝘪𝘯𝘨 𝘪𝘯 𝘺𝘰𝘶𝘳 𝘯𝘦𝘪𝘨𝘩𝘣𝘰𝘶𝘳𝘩𝘰𝘰𝘥? Obtain a personalized market analysis by booking a complimentary Buyer or Seller consultation with us via the form below.


.Toronto real estate market update June 2025 Mississauga real estate market update June 2025 Oakville real estate market update June 2025 Burlington real estate market update June 2025


Do you have more market questions?

Get in touch with us by filling out the form below.

  • This field is for validation purposes and should be left unchanged.

Toronto Real Estate Market Update - May 2025

Toronto & West GTA Real Estate Market Update – May 2025

Jun 25, 2025 | Market News

Toronto Real Estate Market Update - May 2025Mississauga Real Estate Market Update - May 2025Oakville Real Estate Market Update - May 2025Burlington Real Estate Market Update - May 2025

  • This field is for validation purposes and should be left unchanged.

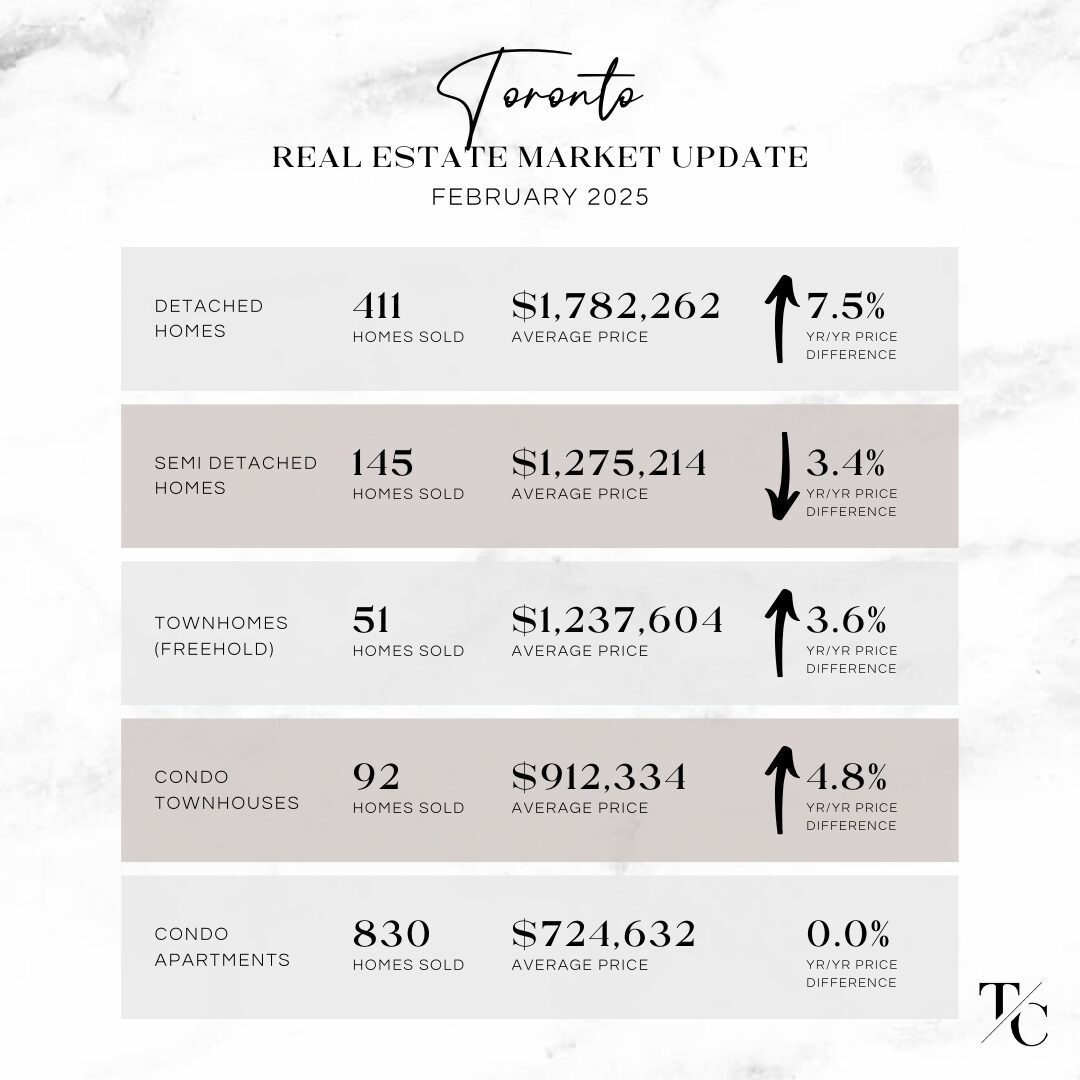
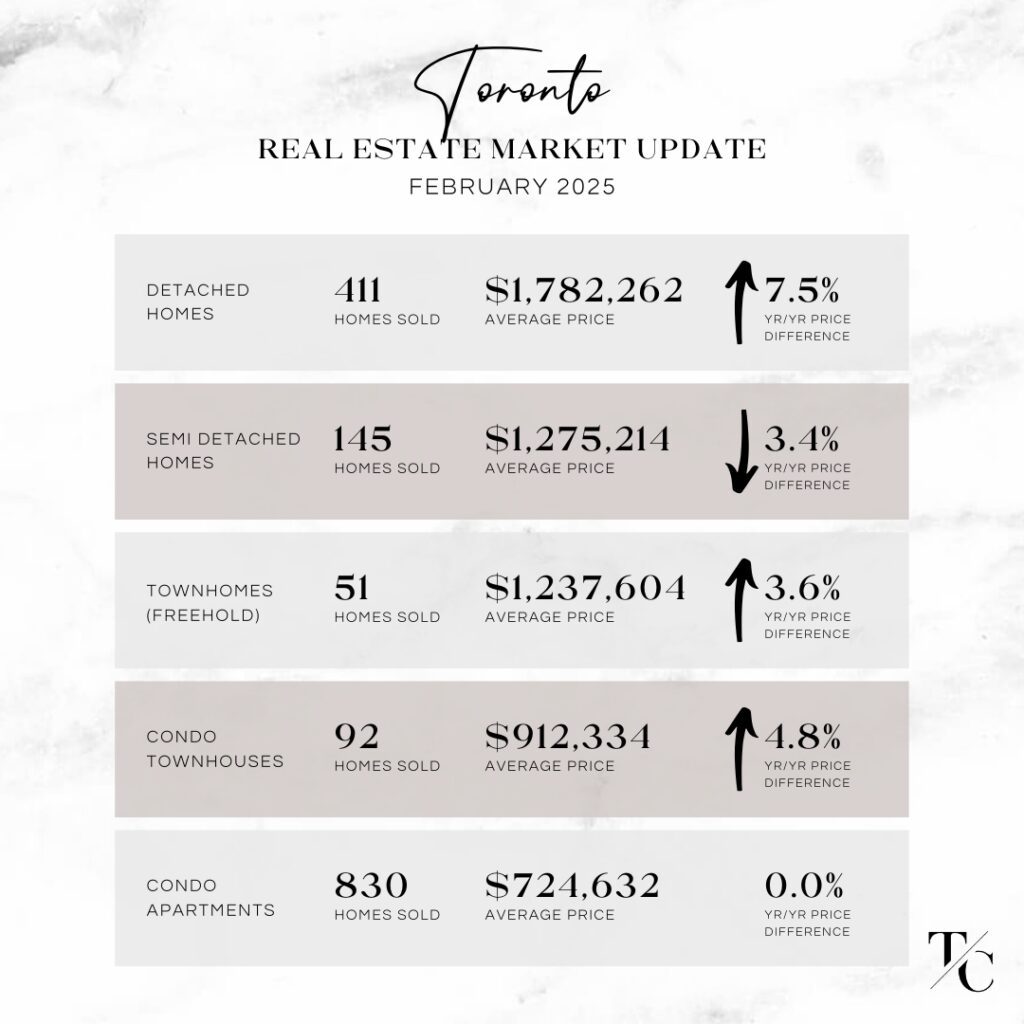
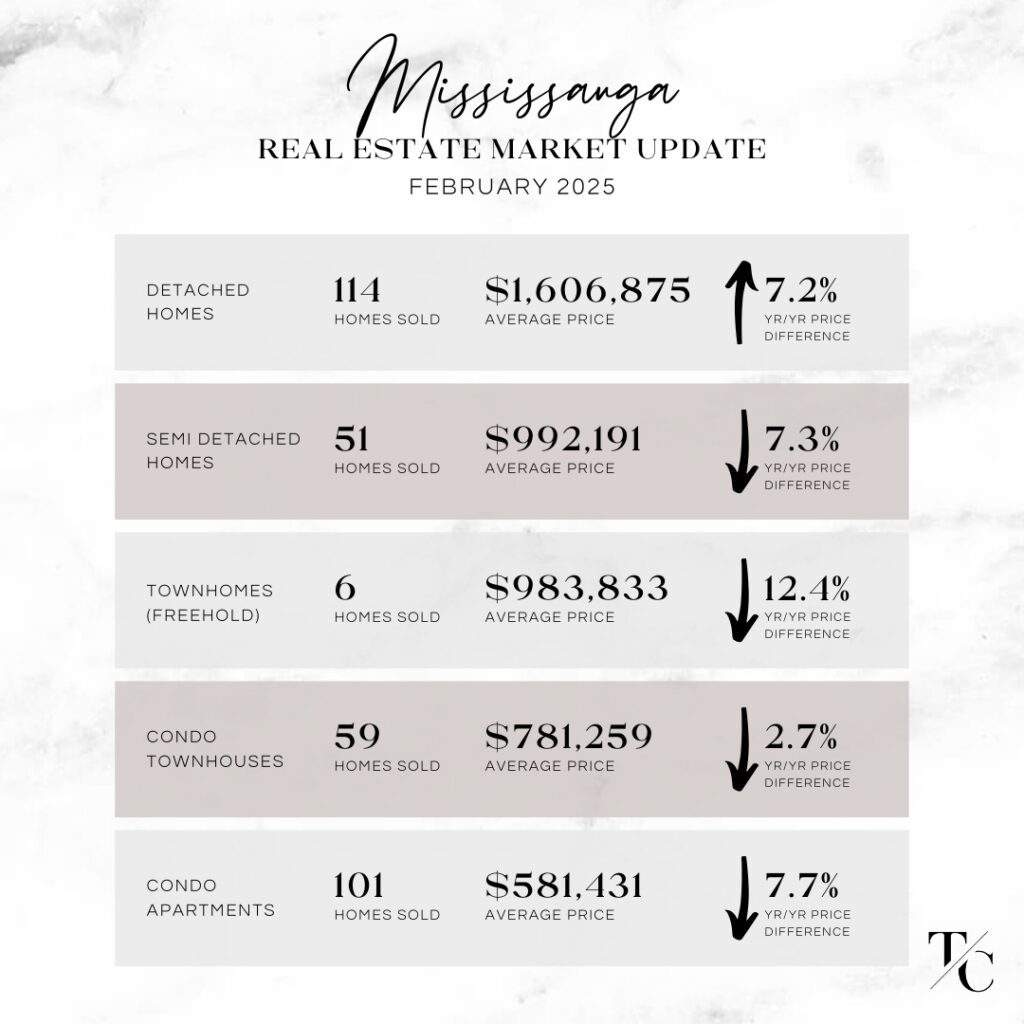
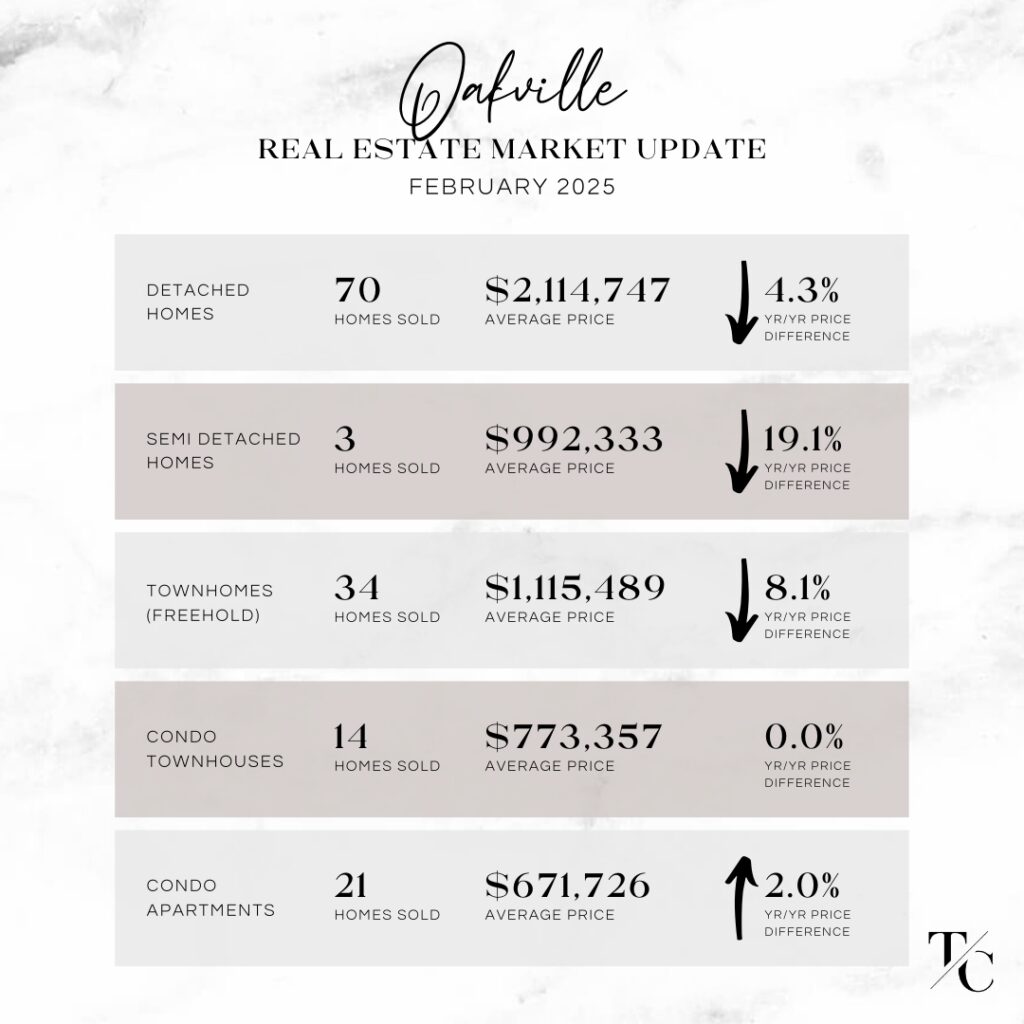
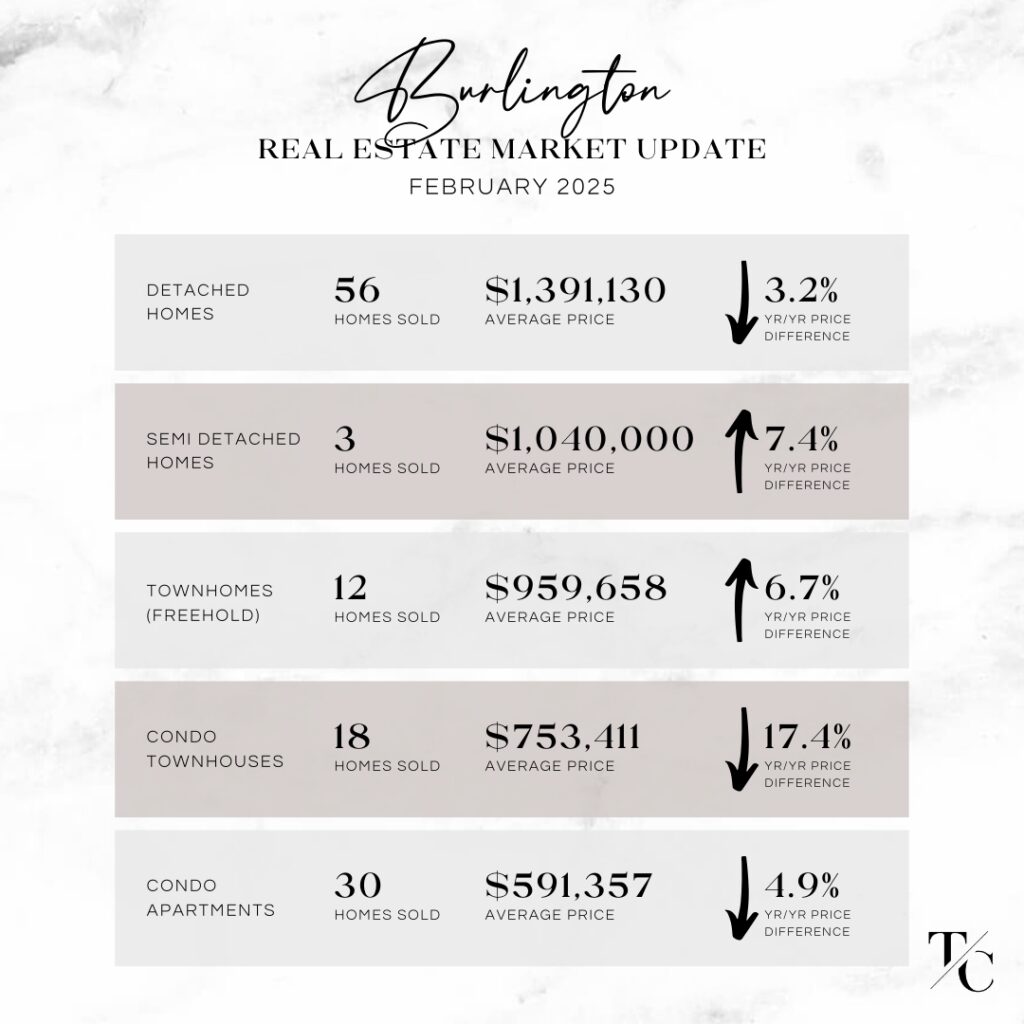
Toronto Real Estate Market Update - February 2025

Toronto and West GTA Real Estate Market Update – February 2025

Mar 25, 2025 | Market News

𝐍𝐄𝐖𝐒𝐅𝐋𝐀𝐒𝐇! Here are the real estate market stats you need to know for February 2025 vs. 2024 home sales in Toronto, Mississauga, Oakville, and Burlington. 📢

Is it just us or has Q1 of 2025 flown by? The real estate market continues to be better supplied than this time last year, however what’s important to note is that properties are selling yet with varied activity depending on the location, product type and price point.

Savvy Buyers and Sellers know to quiet the noise from the media regarding factors beyond anyone’s control and focus in on what their unique goals are.

What’s critical today is that you have a skilled and knowledgeable Realtor on your side as you navigate the current market. If selling, proper preparation and planning, pricing strategy, stellar marketing and sharp negotiation skills should be paramount. When buying, a sharp pulse on the local market, strong negotiation skills, client focused service and a collaborative approach is the recipe for success.

The real estate market is nuanced, and it’s important that you hire the right person who possesses all of the distinctive qualities to ensure your successful real estate journey.

💡 Here’s what stood out with the month over month activity between January and February 2025

◼️ Toronto average detached home values jumped $200,000 between January and February. In fact, all home types were up month over month, with the next largest increase in semi-detached homes – up $125,000 over the month prior.

◼️ Mississauga on the other hand flat to the month prior across all categories (slight dip, however marginal). Where it gets interesting in Mississauga, is that all categories excluding detached homes were down as compared to February 2024. Detached homes were the only positive year/year difference, up 7% to last year (yet flat to last month).

◼️ Oakville detached home values saw a huge jump month over month – up $261,000 over January. All other home types were down, most notably semi-detached homes, down $230,000 over the month prior while being down 19% over last year. Condo apartments were also down over $100k as compared to January suggesting that the condo market in Oakville is ripe with opportunity.

◼️ Burlington detached home values saw the largest drop in our report based on the month over month figures. Down $141,000 over January and down 3.2% over last year. Whereas semi-detached homes were up close to $150,000 on the month over month suggesting that those who bought in Burlington last month were those seeking value for the price in a sub $1.4m category. Condo townhouses saw a huge drop month over month, down $150,000 and also down 17% over last year. A value driven price point was also evident in condo apartment activity, with the average price dipping below $600k – which we haven’t seen this low in a while.

Want to know what’s happening in your neighbourhood? Obtain a personalized market analysis by booking a complimentary Buyer or Seller consultation with us via the form below, or call us at 647-293-3785.

Toronto Real Estate Market Update - February 2025Mississauga Real Estate Market Update - February 2025Oakville Real Estate Market Update - February 2025Burlington Real Estate Market Update - February 2025

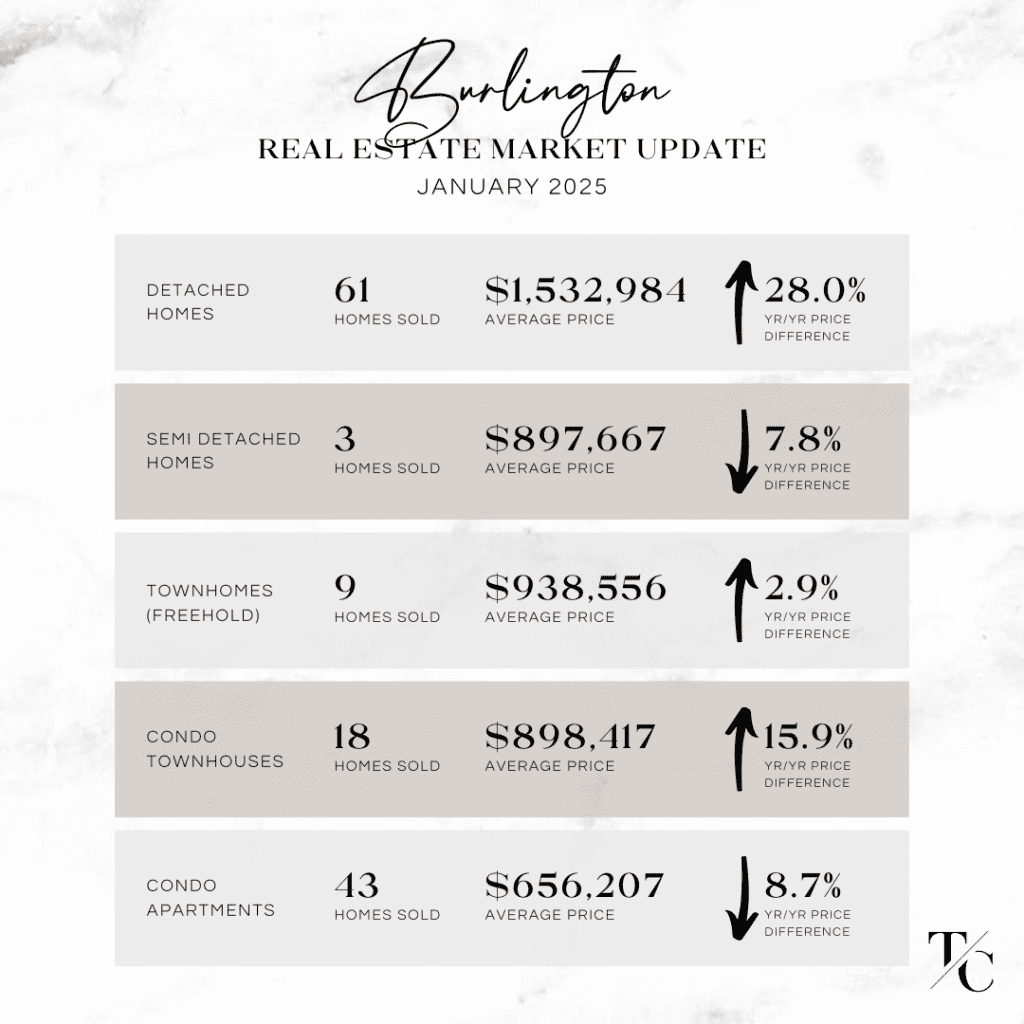
Toronto real estate market update for January 2025

Toronto and West GTA Real Estate Market Update – January 2025

Feb 21, 2025 | Market News

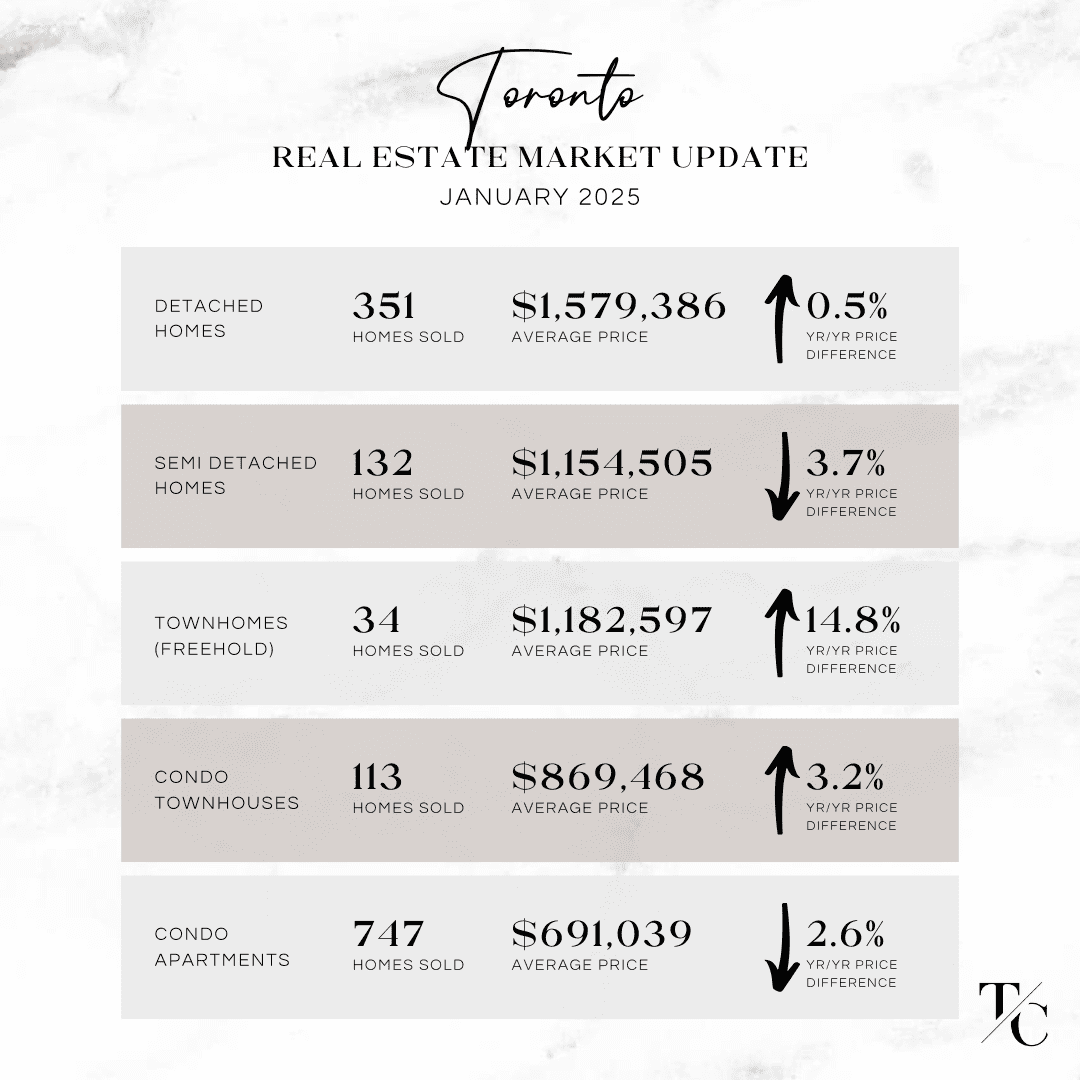
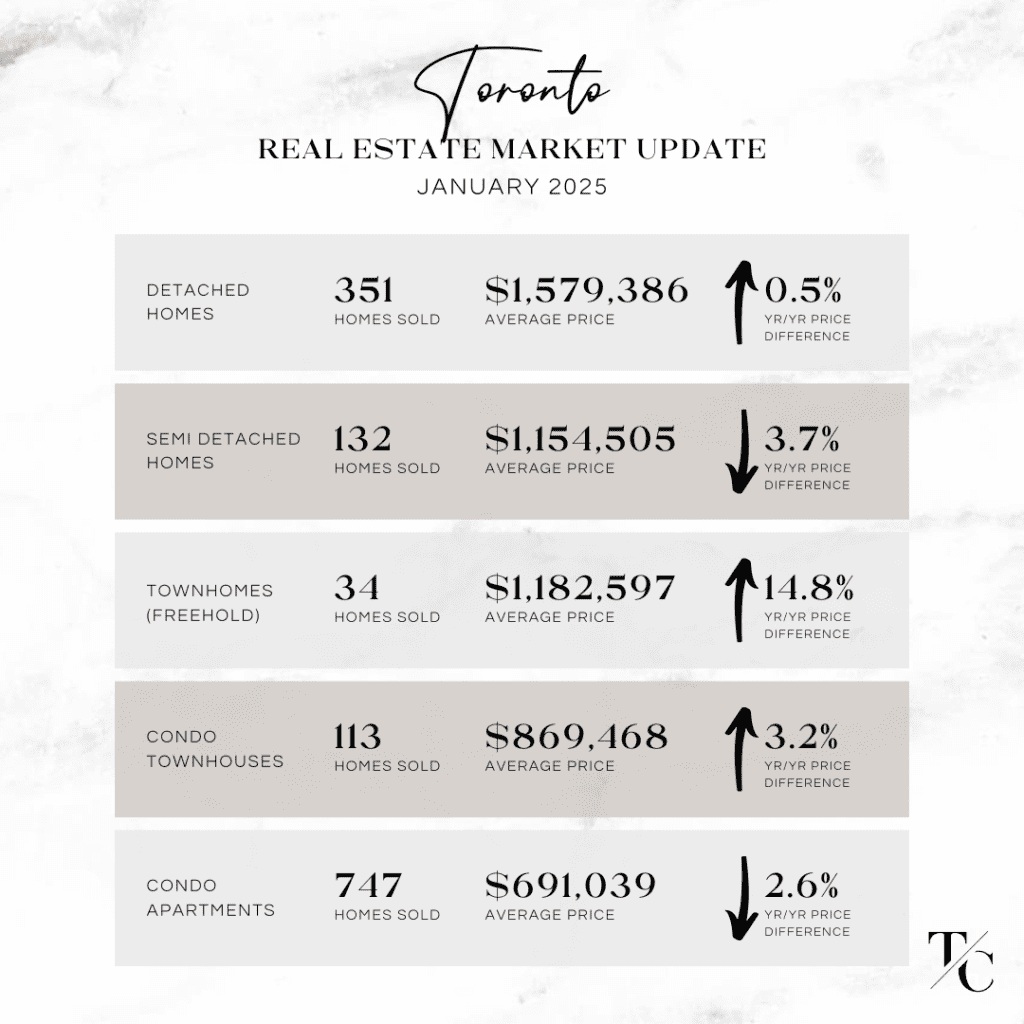
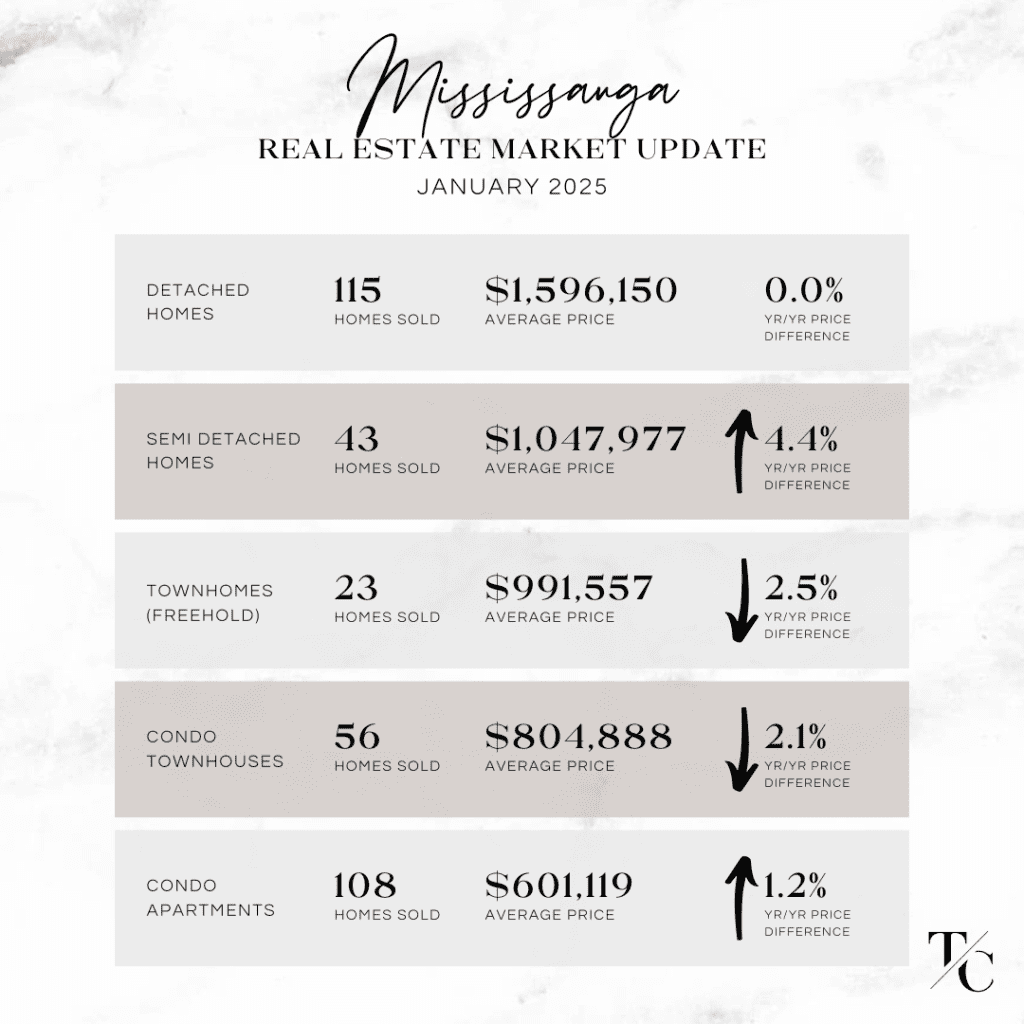
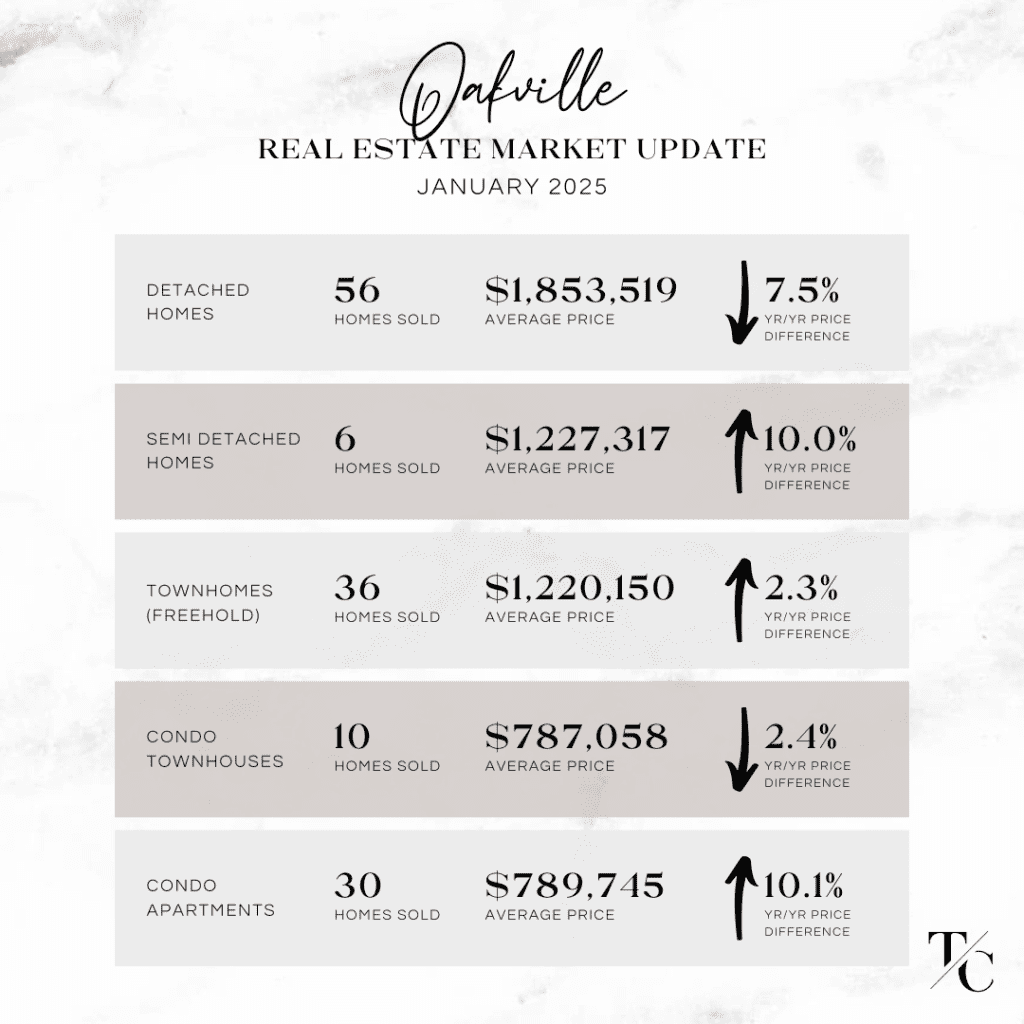
Here are the real estate market stats you need to know for January 2025 Vs. 2024.


Toronto real estate market update for January 2025Mississauga real estate market update for January 2025Oakville real estate market update for January 2025Burlington real estate market update for January 2025

Toronto and West GTA Real Estate Market Update – December 2024

Jan 24, 2025 | Market News

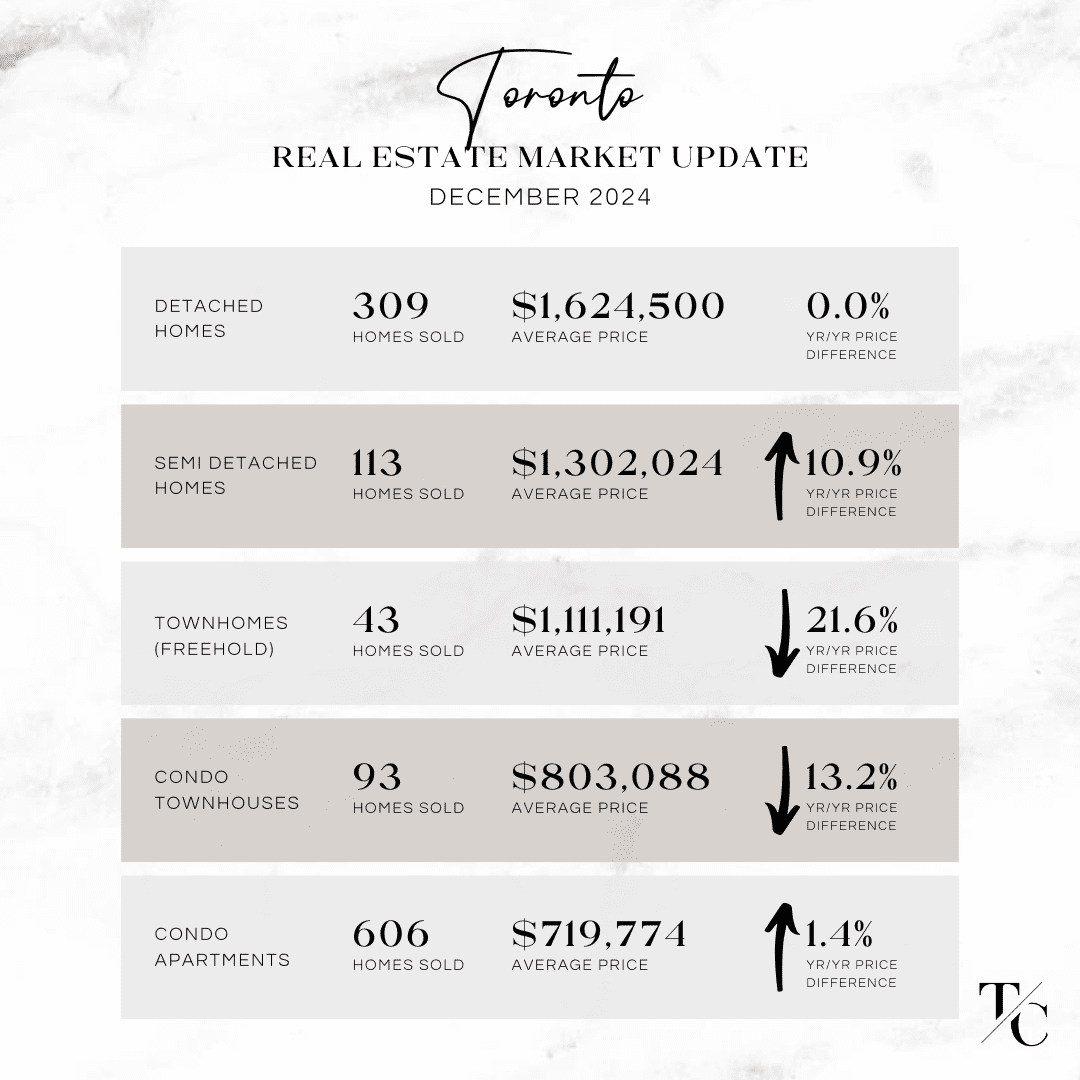
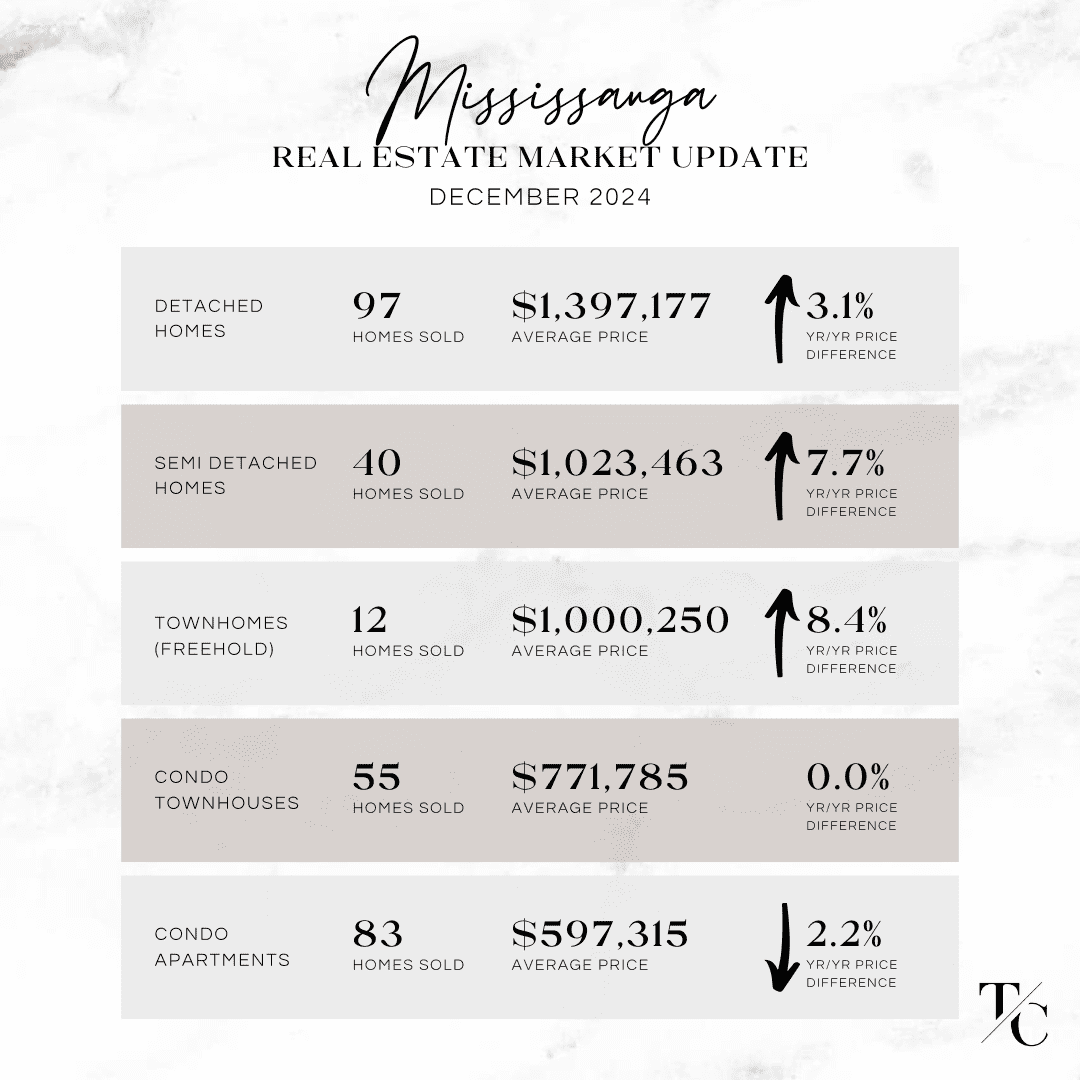
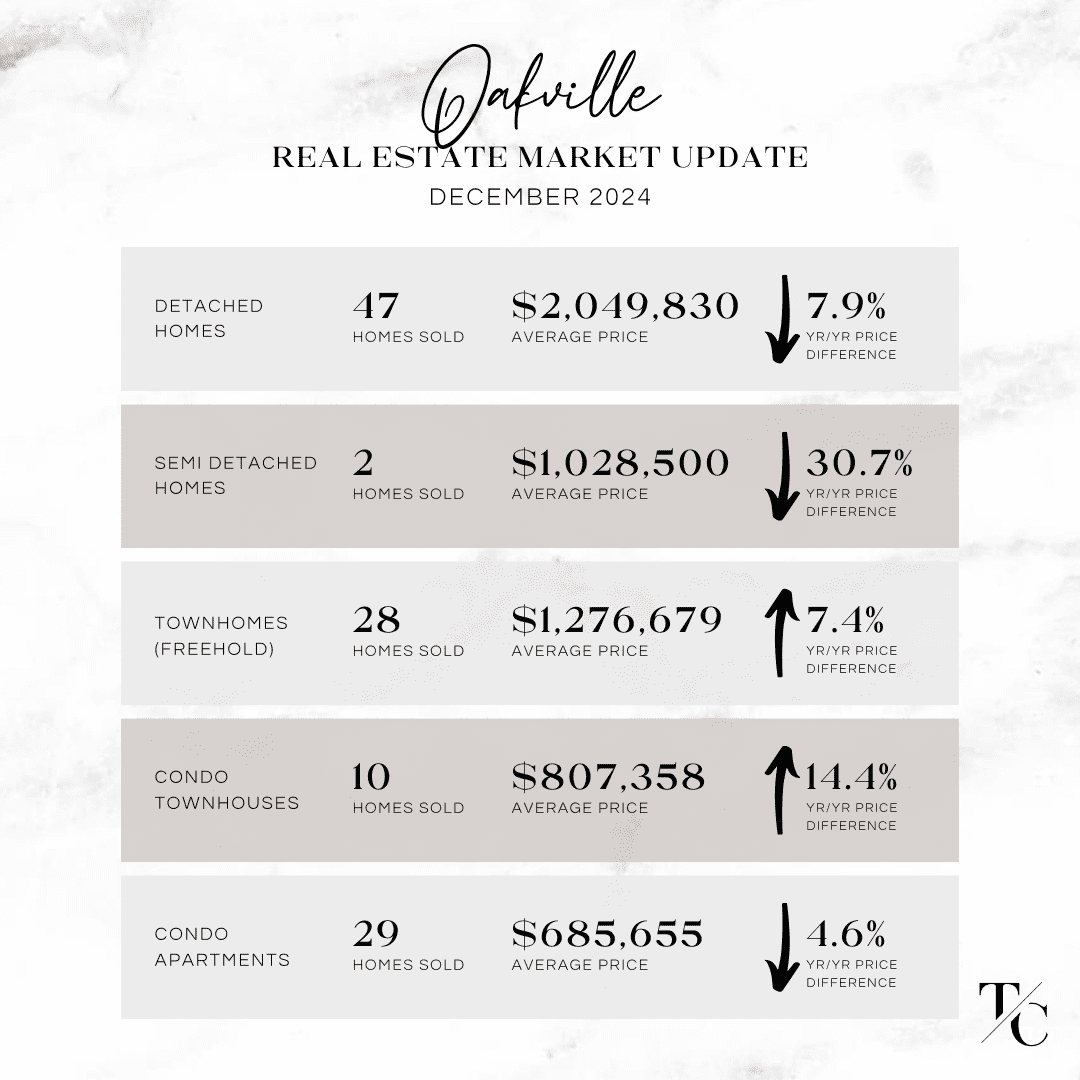
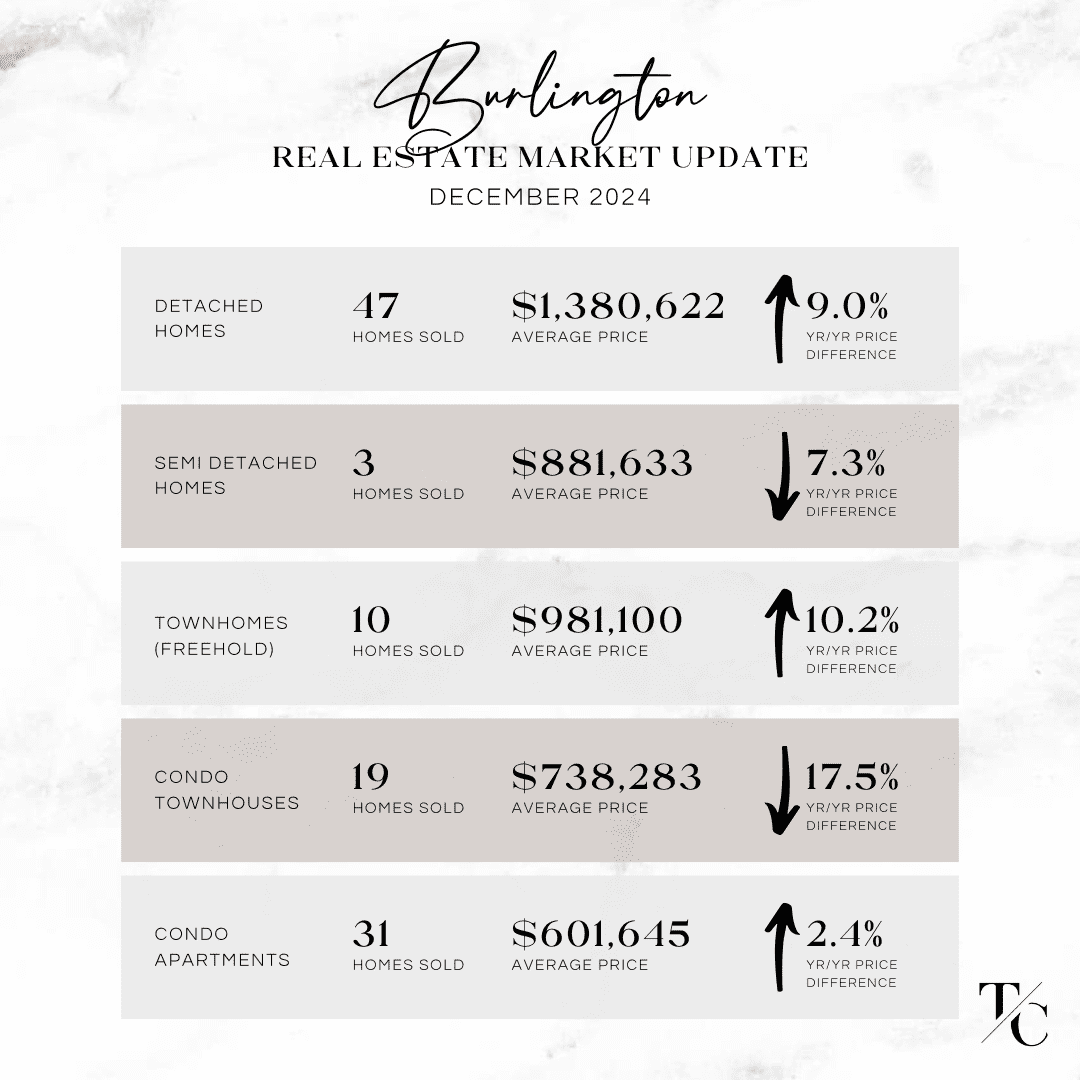
𝐍𝐄𝐖𝐒𝐅𝐋𝐀𝐒𝐇! Here are the real estate market stats you need to know for December 2024 vs. 2023 home sales in Toronto, Mississauga, Oakville, Burlington 📢

Market activity in December varied across the areas in our report as compared to the same time last year. For example, where detached home prices may have been up year over year in Burlington, they were down in Oakville and flat in Toronto.

As an overall, new listings were up in 2024 at a greater annual rate then in 2023 and with a significant difference than the sell-through, providing buyers with considerable choice, impacting the rate of price growth.

Be sure to review our infographic slides for specific details by each home type and how it compares year over year.

💡 Here are our notable take away’s from the December 2024 real estate market activity and how it compared month over month with November:

◼️ Toronto average detached home price was flat month over month, semi detached average price up $50,000, freehold townhouses flat, condo townhouses pretty much flat (up by $25,000) and condo apartments flat month over month. No real significant change on a month over month basis in Toronto. Where we saw a greater impact was the year/year for semi detached homes up 11% over December 2023, along with a big drop in freehold towns: down 21% and condo towns down 13% year over year.

◼️ Mississauga home values were pretty consistent across all categories on a month over month basis. The detached average home price was down $25,000, semi-detached up $25,000, freehold townhouses up $65,000. Condo townhouses were flat, and condo apartments were pretty much flat – down by $18,000.

◼️ Oakville detached home values were down $80,000 month over month, semi-detached were flat, while the townhouse categories were both up: freehold townhouses up $150,000 and condo townhouses up $100,000 over the month prior. Opportunity continues in the condo apartment sector with the average price down $65,000 month over month. What stood out in Oakville was the drop in the average detached home price as compared to December 2024: down 8%, and semi-detached homes down 30% over last year – although this figure may be skewed from the lack of adequate homes sold, as only two semi-detached homes sold in Oakville for December 2024. Notable mention regarding condo townhouses, up almost 14.5% compared to last year.

◼️ Burlington home values were down across almost all categories on a month over month basis. The average detached home price was down $60,000, opportunity was evident for semi-detached homes, down $120,000. Freehold townhouses were the only home type up slightly over the month prior. Condo townhouses were down $80,000 and condo apartments with the biggest month over month drop, down $150,000.

𝗪𝗮𝗻𝘁 𝘁𝗼 𝗸𝗻𝗼𝘄 𝘄𝗵𝗮𝘁’𝘀 𝗵𝗮𝗽𝗽𝗲𝗻𝗶𝗻𝗴 𝗶𝗻 𝘆𝗼𝘂𝗿 𝗻𝗲𝗶𝗴𝗵𝗯𝗼𝘂𝗿𝗵𝗼𝗼𝗱? Obtain a personalized market analysis by booking a complimentary Buyer or Seller consultation with us via the link below.

Toronto real estate market update December 2024 Mississauga real estate market update December 2024 Oakville real estate market update December 2024 Burlington real estate market update December 2024

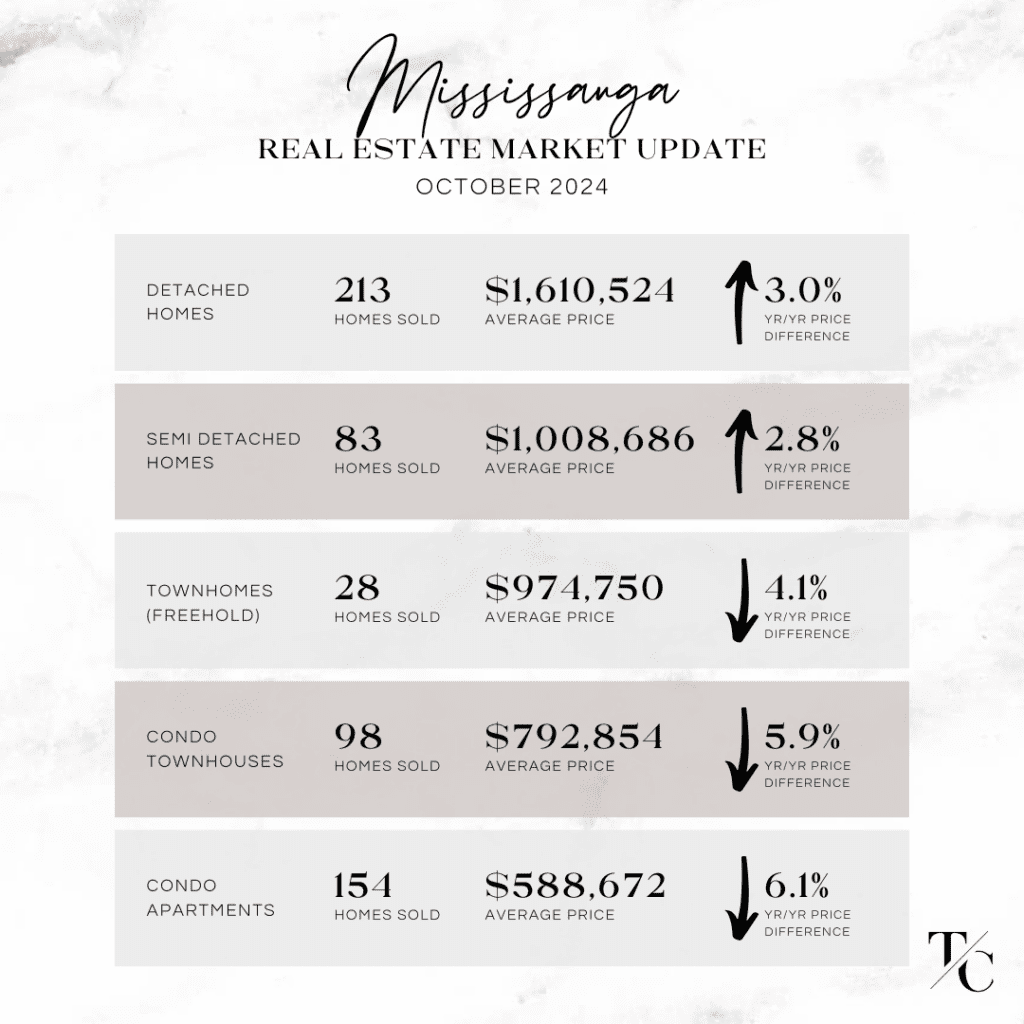
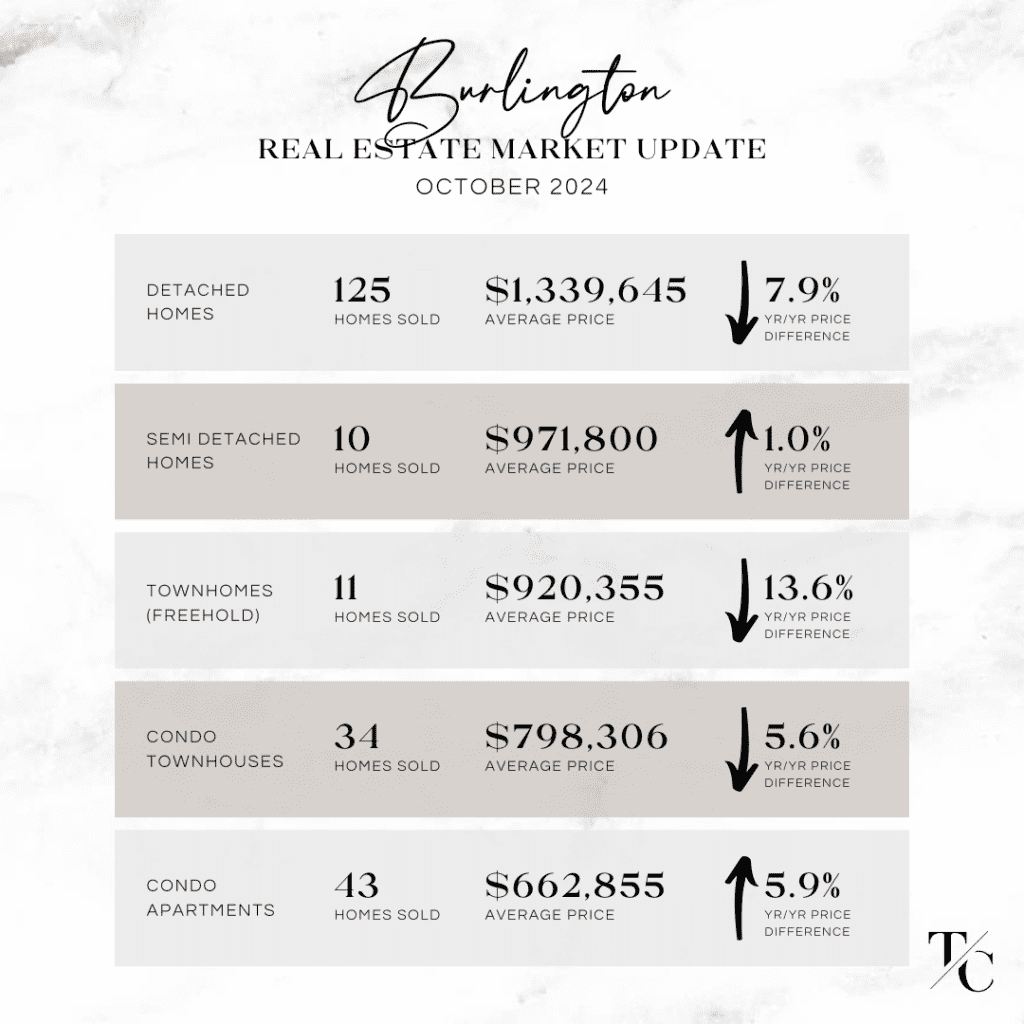
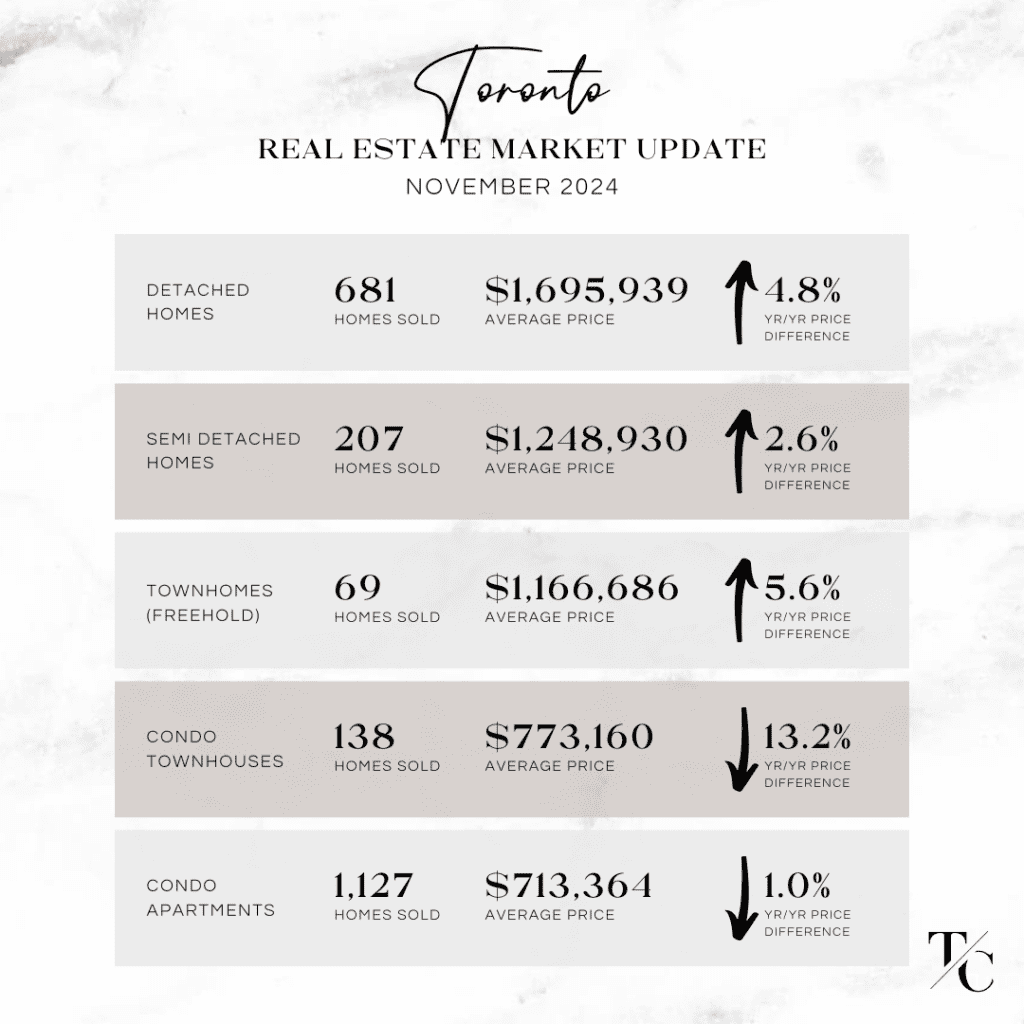
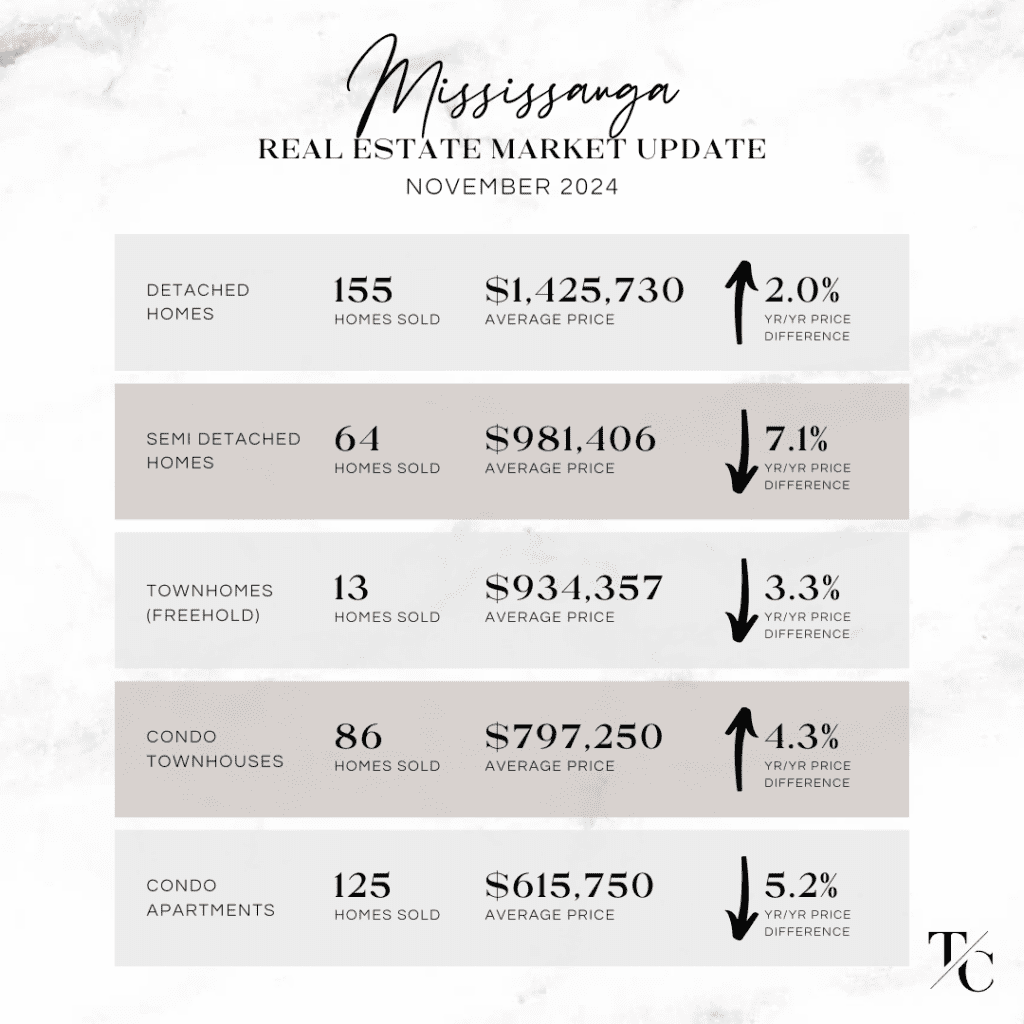
Toronto Real estate market update November 2024

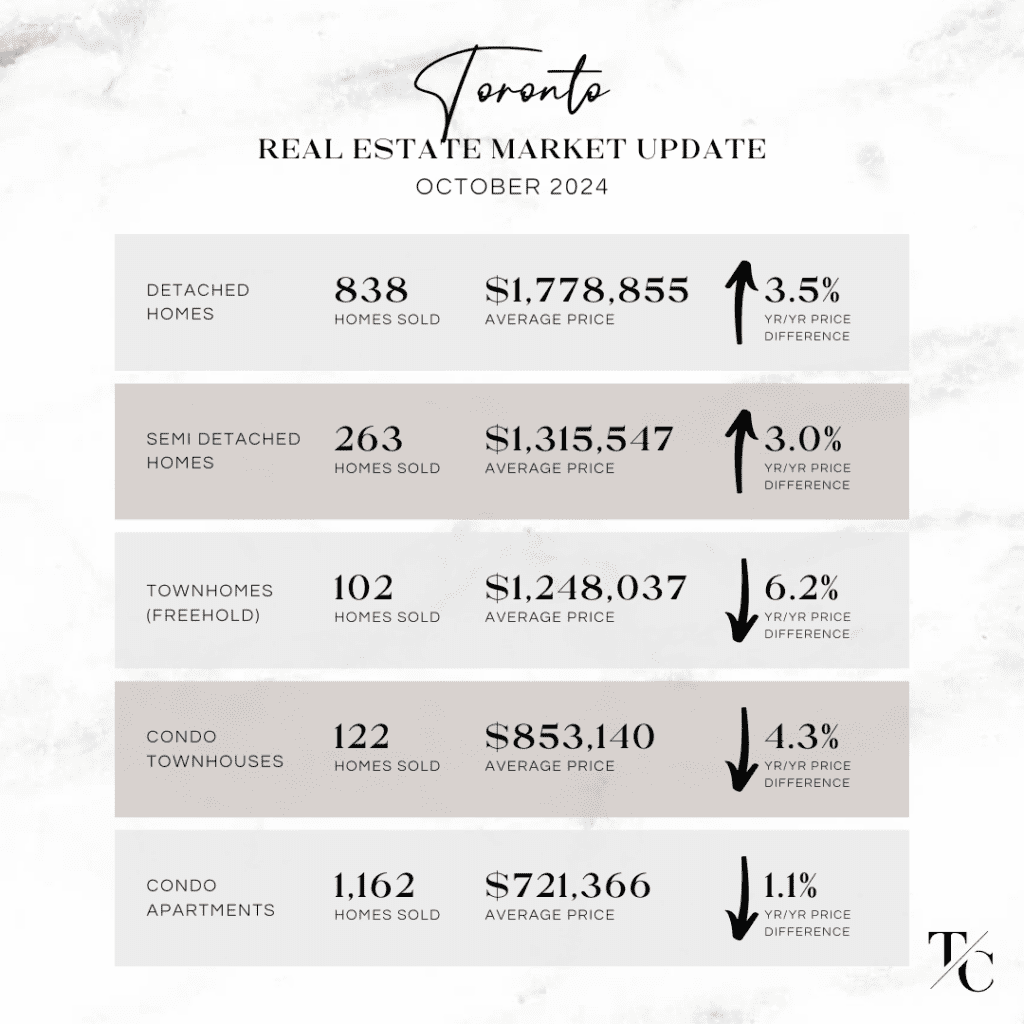
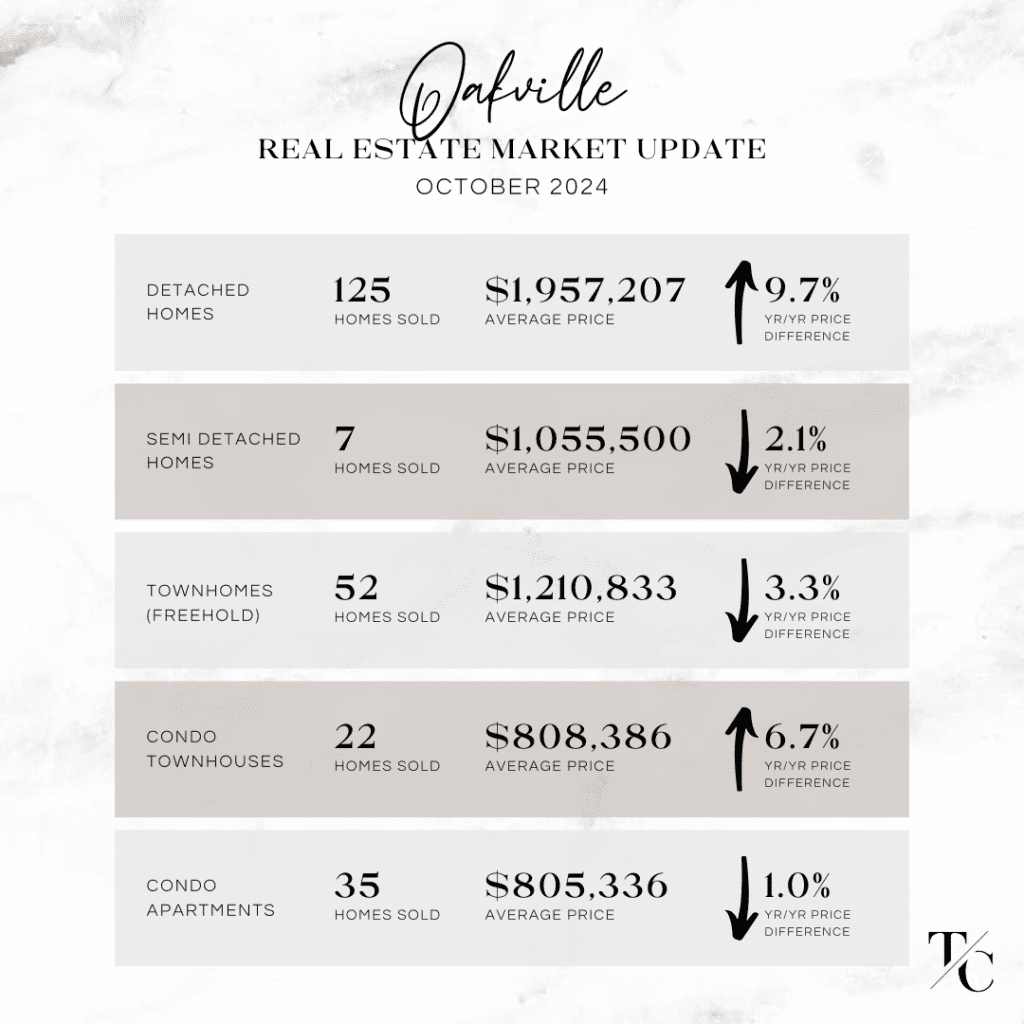
Toronto and West GTA Real Estate Market Update – October & November 2024

Dec 13, 2024 | Market News

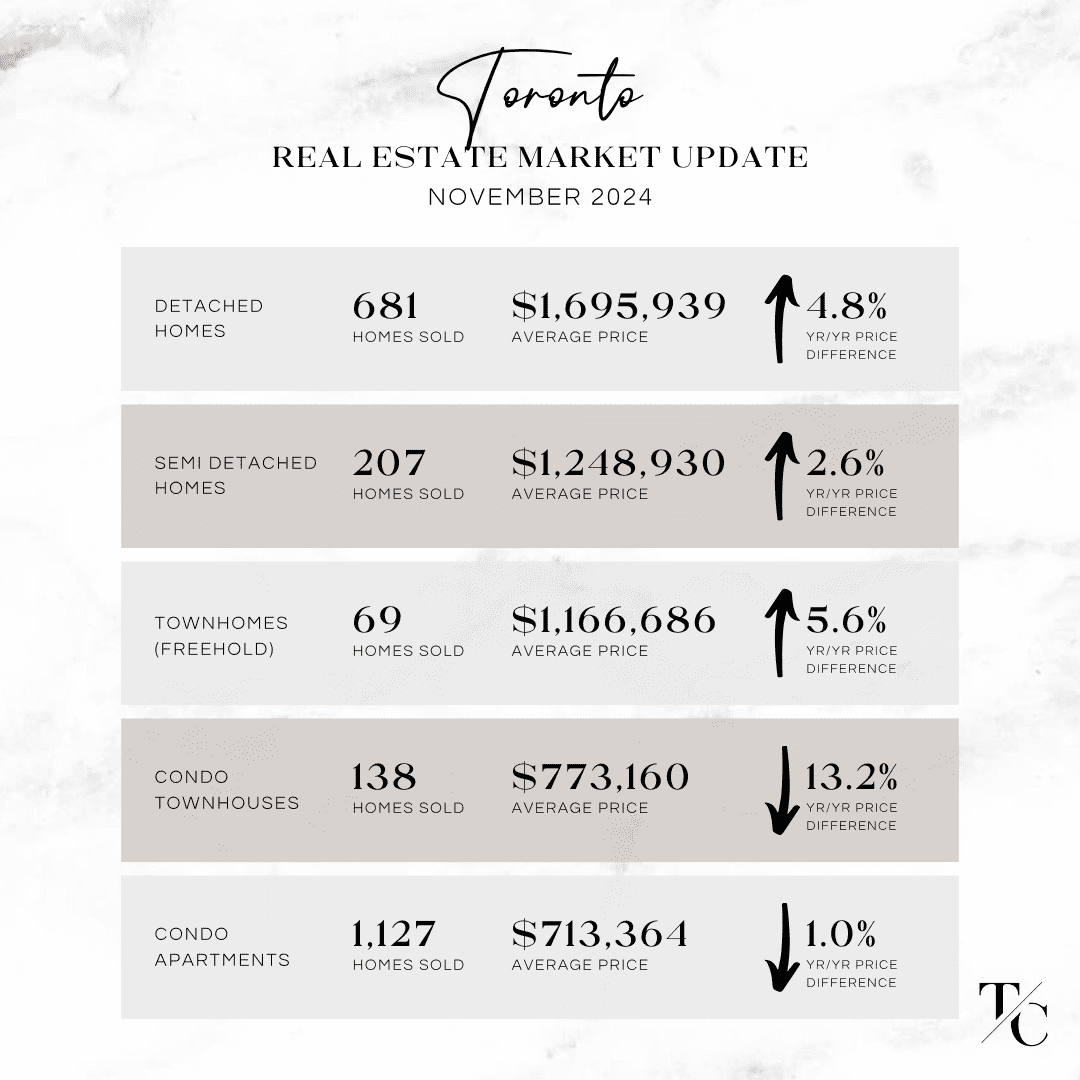
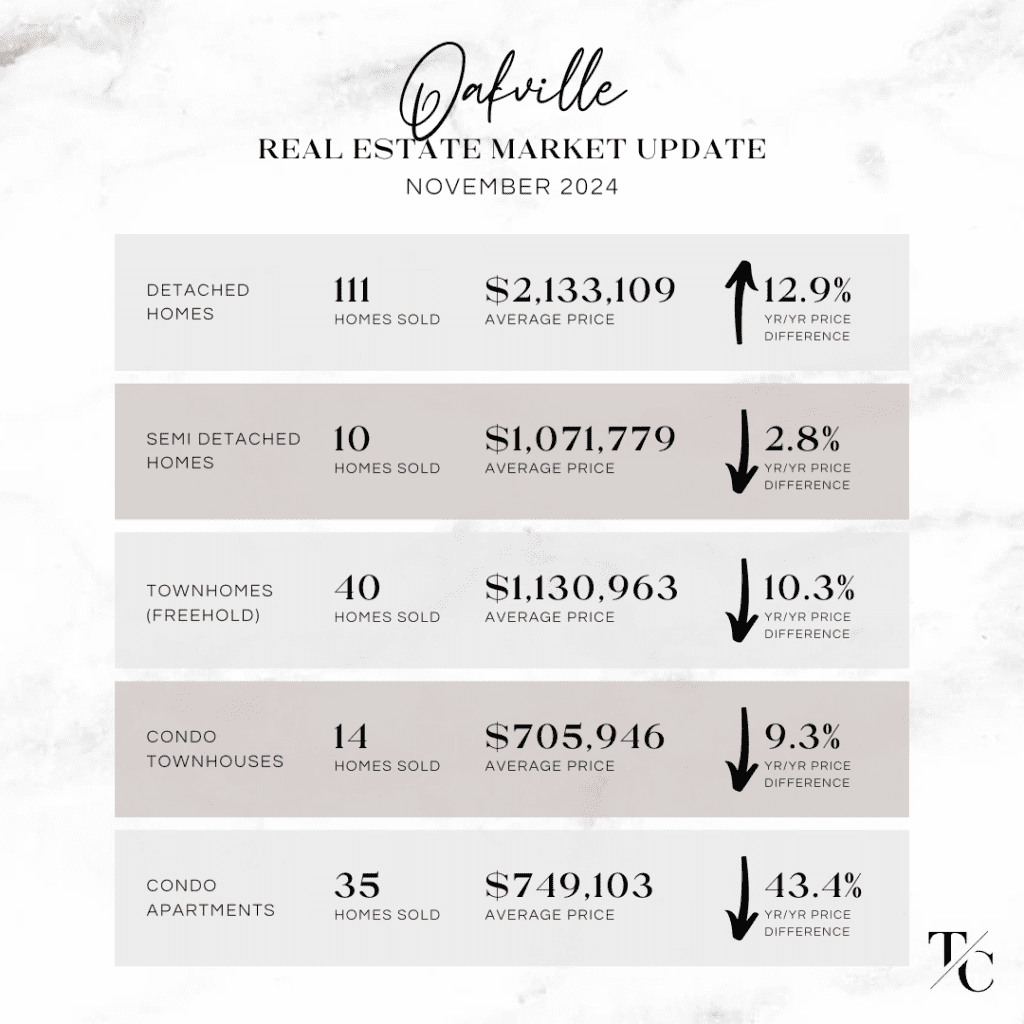
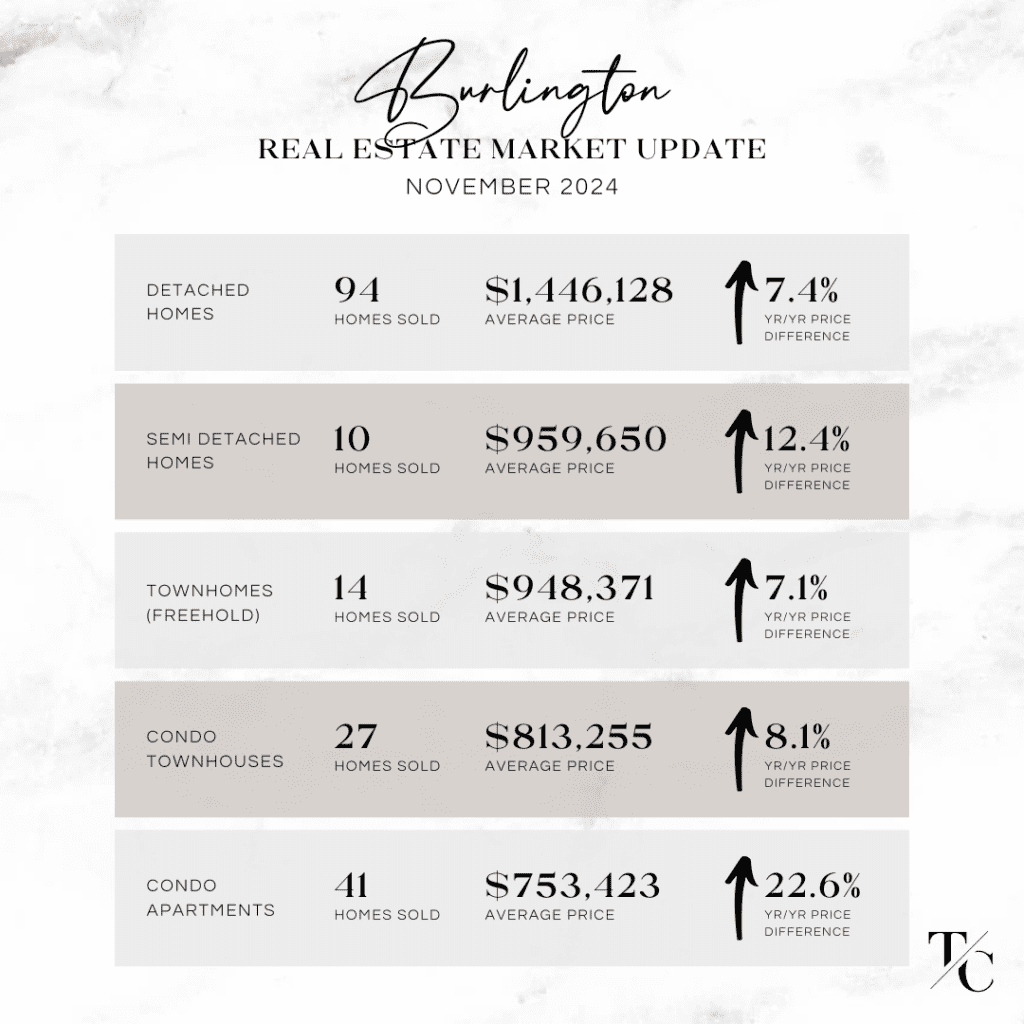
𝐍𝐄𝐖𝐒𝐅𝐋𝐀𝐒𝐇! Here are the real estate market stats you need to know for November 2024 vs. 2023 home sales in Toronto, Mississauga, Oakville, Burlington 📢

November brought a mixed bag of market activity across the areas in our report. Detached home values were up across the board compared to last year, with Burlington being the only area showing an increase in values for all property types.

Oakville detached homes saw the largest year-over-year increase in November, up nearly 13%, with an average price surpassing $2.1M.

Interestingly, when comparing month-over-month activity between October and November, 𝘴𝘰𝘮𝘦 𝘷𝘢𝘭𝘶𝘦𝘴 𝘸𝘦𝘳𝘦 𝘢𝘤𝘵𝘶𝘢𝘭𝘭𝘺 𝘥𝘰𝘸𝘯 𝘪𝘯 𝘕𝘰𝘷𝘦𝘮𝘣𝘦𝘳. In Toronto proper, the average sale price decreased across all property types, though condo prices remained flat compared to the previous month.

View the infographic slides for a detailed comparison between the November and October stats update!

___

Want to know what’s happening in your neighbourhood? Obtain a personalized market analysis by booking a complimentary Buyer or Seller consultation with us via the form below.

October 2024

Toronto October 2024 Real Estate Market UpdateOakville October 2024 Real Estate Market UpdateMississauga October 2024 Real Estate Market UpdateBurlington October 2024 Real Estate Market Update

November 2024

Toronto Real estate market update November 2024Mississauga Real estate market update November 2024Oakville Real estate market update November 2024Burlington Real estate market update November 2024

Do you have questions?

Get in touch here.

  • This field is for validation purposes and should be left unchanged.

Toronto real estate market update September 2024

Toronto and West GTA Real Estate Market Update – September 2024

Oct 21, 2024 | Market News

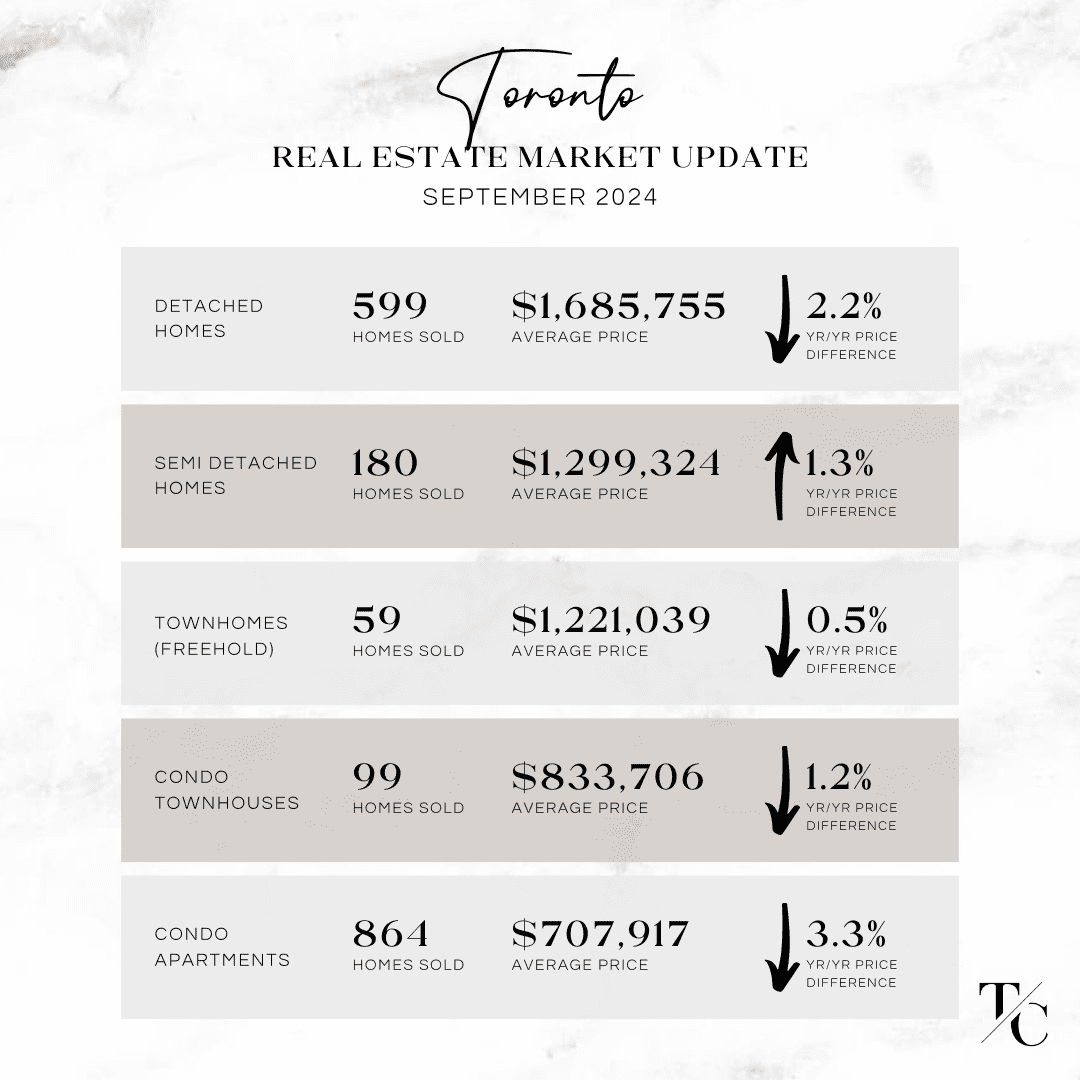
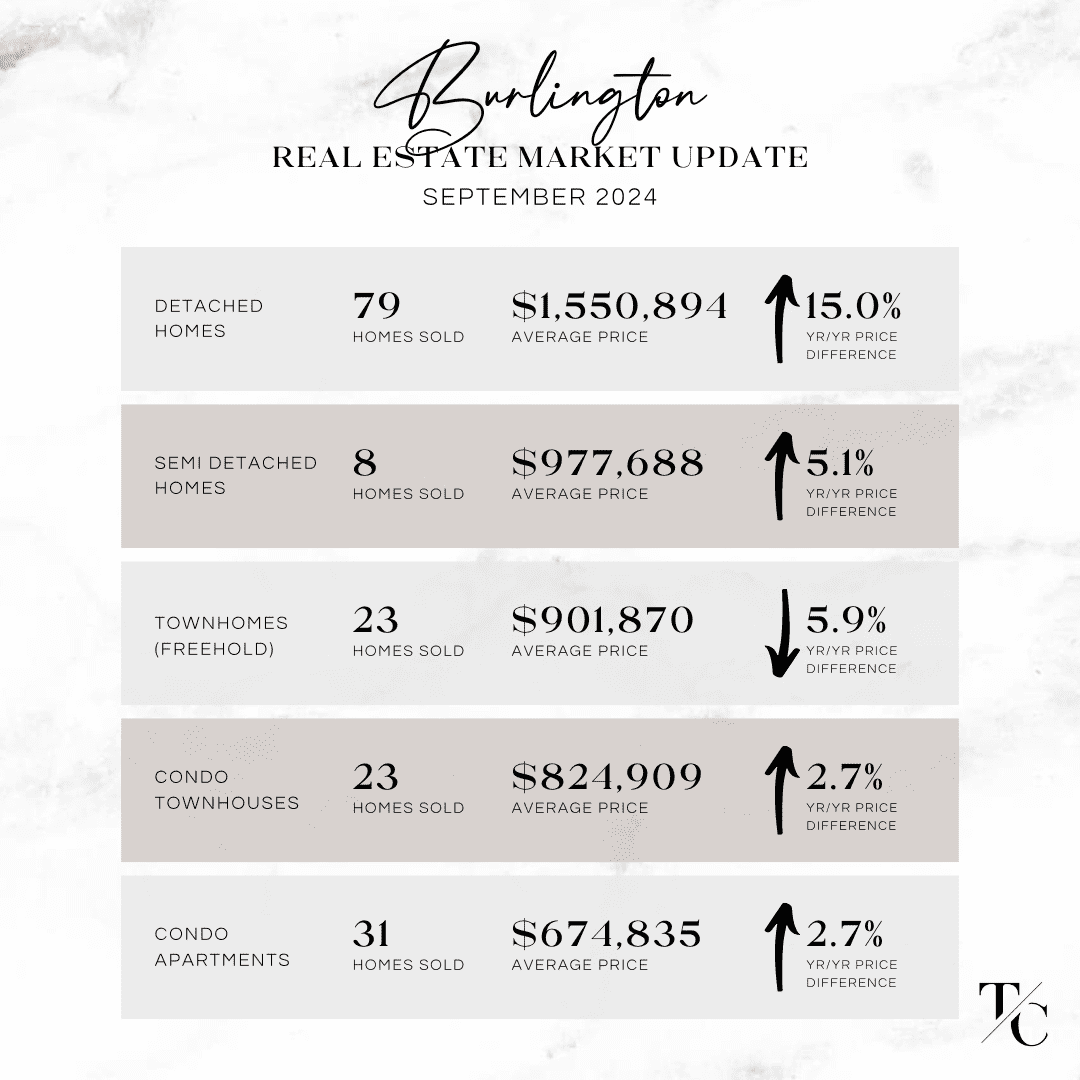
𝐍𝐄𝐖𝐒𝐅𝐋𝐀𝐒𝐇! Here are the real estate market stats you need to know for September 2024 vs. 2023 home sales in Toronto, Mississauga, Oakville, Burlington 📢

September brought an increase in the number of homes sold, up 8.5% as compared to last year, and also up on a monthly basis compared to August. It’s important to note however that new listings were up 10.5% year over year, therefore the rate of sale has not outpaced supply.

In most areas we are still very much in Buyers market conditions, some edging more towards balanced. Certain pockets of Toronto proper on the other hand are experiencing multiple offers however this is on a case-by-case scenario largely factored by product type, the amount of competing inventory and price point.

𝗛𝗲𝗿𝗲 𝗮𝗿𝗲 𝗼𝘂𝗿 𝗻𝗼𝘁𝗮𝗯𝗹𝗲 𝘁𝗮𝗸𝗲 𝗮𝘄𝗮𝘆’𝘀 𝗳𝗿𝗼𝗺 𝘁𝗵𝗲 𝗦𝗲𝗽𝘁𝗲𝗺𝗯𝗲𝗿 𝗿𝗲𝗮𝗹 𝗲𝘀𝘁𝗮𝘁𝗲 𝗺𝗮𝗿𝗸𝗲𝘁 𝗮𝗰𝘁𝗶𝘃𝗶𝘁𝘆 𝗮𝗻𝗱 𝗵𝗼𝘄 𝗶𝘁 𝗰𝗼𝗺𝗽𝗮𝗿𝗲𝘀 𝗺𝗼𝗻𝘁𝗵 𝗼𝘃𝗲𝗿 𝗺𝗼𝗻𝘁𝗵 𝘄𝗶𝘁𝗵 𝗔𝘂𝗴𝘂𝘀𝘁 𝟮𝟬𝟮𝟰:

◾️Toronto detached home values flat month over month, and with the average price down about 2% compared to last year. All other home values pretty much flat month over month.

◾️Mississauga detached home values down $90,000 month over month, providing for what could be a short-lived opportunity to buy a detached home at an excellent value. All other home types flat month over month.

◾️Oakville detached home values back up for September and a huge jump from August, up by approximately $240,000. This could be based on higher price point homes sold, and the rush to close on a new home in time for the school year. Where detached home values were up on a month-over-month basis, other home types are ripe with opportunity as their values slipped: freehold townhouses down just over $100,000, condo townhouses down $80,000 and condo apartments down $120,000 as compared to just one month prior.

◾️Burlington detached home values flat to last month and up 15% over last year with the largest year/year category gain of the areas in our report. Opportunity knocks in freehold townhouse values, down by $145,000 to just over $900k average townhouse price in September (an excellent value for freehold). Condo apartments also down by close to $70,000 not surprisingly.

𝗪𝗮𝗻𝘁 𝘁𝗼 𝗸𝗻𝗼𝘄 𝘄𝗵𝗮𝘁’𝘀 𝗵𝗮𝗽𝗽𝗲𝗻𝗶𝗻𝗴 𝗶𝗻 𝘆𝗼𝘂𝗿 𝗻𝗲𝗶𝗴𝗵𝗯𝗼𝘂𝗿𝗵𝗼𝗼𝗱? Obtain a personalized market analysis by booking a complimentary Buyer or Seller consultation with us via the form below.

Toronto real estate market update September 2024Mississauga real estate market update September 2024Oakville real estate market update September 2024Burlington real estate market update September 2024

Toronto and West GTA Real Estate Market Update – July 2024

Aug 22, 2024 | Market News

𝐍𝐄𝐖𝐒𝐅𝐋𝐀𝐒𝐇! Here are the real estate market stats you need to know for July 2024 vs. 2023 home sales in Toronto, Mississauga, Oakville, Burlington 📢

Sales volume was up in the GTA this July as compared to July 2023, however the average selling price for the majority of the product within the areas in our report was down compared to last year.

Buyers also benefited from greater selection as new listings were up over 18% over the previous year across all areas on the Toronto Regional Real Estate Board.

𝗛𝗲𝗿𝗲 𝗮𝗿𝗲 𝗼𝘂𝗿 𝗻𝗼𝘁𝗮𝗯𝗹𝗲 𝘁𝗮𝗸𝗲 𝗮𝘄𝗮𝘆’𝘀 𝗳𝗿𝗼𝗺 𝘁𝗵𝗲 𝗝𝘂𝗹𝘆 𝗿𝗲𝗮𝗹 𝗲𝘀𝘁𝗮𝘁𝗲 𝗺𝗮𝗿𝗸𝗲𝘁 𝗮𝗰𝘁𝗶𝘃𝗶𝘁𝘆 𝗮𝗻𝗱 𝗵𝗼𝘄 𝗶𝘁 𝗰𝗼𝗺𝗽𝗮𝗿𝗲𝘀 𝗺𝗼𝗻𝘁𝗵 𝗼𝘃𝗲𝗿 𝗺𝗼𝗻𝘁𝗵 𝘄𝗶𝘁𝗵 𝗝𝘂𝗻𝗲 𝟮𝟬𝟮𝟰:

◼️ Toronto detached home values down $90,000 month over month, and flat to last year. Freehold townhouses down $100,000 month over month, however freehold towns were the only category where home values were up over last year. All other home types flat month over month.

◼️ Mississauga detached home values up by close to 4% year over year, and the only area in our report where the detached home values were up. On a month over month comparison, all home categories flat which suggests stability within buyer’s market conditions.

◼️ Good news for Oakville with the average detached home price up $120,000 as compared to the month prior. Detached home values in Oakville had declined from April to June 2024 and are back to what would be a more ‘typical’ figure. Note that detached values are down 4% to last year. Freehold towns were up slightly month over month. Nice improvement in condo apartments, up $70,000 over June and almost 5% over last year.

◼️ Burlington detached home values flat to last month and down slightly to last year. All other home categories flat to last month. Semi-detached values down 9.5% to last year. Condo apartments up on a month over month and to last year.

𝗪𝗮𝗻𝘁 𝘁𝗼 𝗸𝗻𝗼𝘄 𝘄𝗵𝗮𝘁’𝘀 𝗵𝗮𝗽𝗽𝗲𝗻𝗶𝗻𝗴 𝗶𝗻 𝘆𝗼𝘂𝗿 𝗻𝗲𝗶𝗴𝗵𝗯𝗼𝘂𝗿𝗵𝗼𝗼𝗱? Obtain a personalized market analysis by booking a complimentary Buyer or Seller consultation with us via the form below.

Toronto Real Estate Market Update July 2024 Mississauga Real Estate Market Update July 2024 Oakville Real Estate Market Update July 2024Burlington Real Estate Market Update July 2024

Toronto and West GTA Real Estate Market Update – June 2024

Jul 22, 2024 | Market News

𝐍𝐄𝐖𝐒𝐅𝐋𝐀𝐒𝐇! Here are the real estate market stats you need to know for June 2024 vs. 2023 home sales in Toronto, Mississauga, Oakville, Burlington 📢

For the most part in the areas within our report, the average selling price was down compared to June 2023, although with mixed results depending on the location and the product type. We are in an interesting market, that does not have a ‘one size fits all answer’. Yes, we are better supplied with inventory for sale this year, and with a decline in sales volume compared to June 2023 as some Buyers are on the sidelines waiting for further interest rate cuts before making a move.

𝗛𝗲𝗿𝗲 𝗮𝗿𝗲 𝗼𝘂𝗿 𝗻𝗼𝘁𝗮𝗯𝗹𝗲 𝘁𝗮𝗸𝗲 𝗮𝘄𝗮𝘆’𝘀 𝗳𝗿𝗼𝗺 𝘁𝗵𝗲 𝗝𝘂𝗻𝗲 𝗿𝗲𝗮𝗹 𝗲𝘀𝘁𝗮𝘁𝗲 𝗺𝗮𝗿𝗸𝗲𝘁 𝗮𝗰𝘁𝗶𝘃𝗶𝘁𝘆 𝗮𝗻𝗱 𝗵𝗼𝘄 𝗶𝘁 𝗰𝗼𝗺𝗽𝗮𝗿𝗲𝘀 𝗺𝗼𝗻𝘁𝗵 𝗼𝘃𝗲𝗿 𝗺𝗼𝗻𝘁𝗵 𝘄𝗶𝘁𝗵 𝗠𝗮𝘆 𝟮𝟬𝟮𝟰:

◼️ Toronto detached home values down $68,000 month over month, and flat to last year. Opportunity in semi-detached homes, down $130,000 month over month and with the largest decrease in value over last year, down almost 9%. Condo apartments flat on a month over month and annual basis.

◼️ Consistent results in Mississauga across all home types on a month over month basis. Detached homes down 3% compared to last year, aligned with the average decrease in value across the Toronto Regional Real Estate Board areas. The only home category up year/year were freehold townhouses, at a 2% increase.

◼️ Affordability may be a factor in Oakville as the average price for detached homes dropped almost $110,000 over the month prior, which was already down $130,000 from April. Detached homes in Oakville also experienced the largest decrease in the year over year value of the areas in our report, down 11.6%. All other home categories were flat on a month over month basis, suggesting stability in the more attainable price points.

◼️ Burlington detached home values were up by 4.5% year/year and remained consistent with the month prior. There was a point in time when buying a detached home in Burlington was considerably more affordable than Mississauga, however these days they are relatively at par. The appeal of Burlington for people moving from Toronto/Mississauga further west is evident based on quality of life and affordability. In other home types, semi-detached were down almost $100,000 month over month and with a big drop to last year, down 15.4%. Condo townhouses also down $80,000 month over month.

𝗪𝗮𝗻𝘁 𝘁𝗼 𝗸𝗻𝗼𝘄 𝘄𝗵𝗮𝘁’𝘀 𝗵𝗮𝗽𝗽𝗲𝗻𝗶𝗻𝗴 𝗶𝗻 𝘆𝗼𝘂𝗿 𝗻𝗲𝗶𝗴𝗵𝗯𝗼𝘂𝗿𝗵𝗼𝗼𝗱? Obtain a personalized market analysis by booking a complimentary Buyer or Seller consultation with us via the form below.
 

Toronto real estate market update June 2024 Mississauga real estate market update June 2024 Oakville real estate market update June 2024 Burlington real estate market update June 2024

Do you have questions about the market?

Get in touch here.

  • This field is for validation purposes and should be left unchanged.

Toronto and West GTA Real Estate Market Update – May 2024

Jun 27, 2024 | Market News

𝐍𝐄𝐖𝐒𝐅𝐋𝐀𝐒𝐇! Here are the real estate market stats you need to know for May 2024 vs. 2023 home sales in Toronto, Mississauga, Oakville, Burlington 📢

Sales volume and the average selling price for May were at a decline across the Toronto Regional Real Estate Board as compared to year over year, due to last spring’s short-lived pick up in market activity. Further details on this in my commentary below.

𝗛𝗲𝗿𝗲 𝗮𝗿𝗲 𝗼𝘂𝗿 𝗻𝗼𝘁𝗮𝗯𝗹𝗲 𝘁𝗮𝗸𝗲 𝗮𝘄𝗮𝘆’𝘀 𝗳𝗿𝗼𝗺 𝘁𝗵𝗲 𝗠𝗮𝘆 𝗿𝗲𝗮𝗹 𝗲𝘀𝘁𝗮𝘁𝗲 𝗺𝗮𝗿𝗸𝗲𝘁 𝗮𝗰𝘁𝗶𝘃𝗶𝘁𝘆 𝗮𝗻𝗱 𝗵𝗼𝘄 𝗶𝘁 𝗰𝗼𝗺𝗽𝗮𝗿𝗲𝘀 𝗺𝗼𝗻𝘁𝗵 𝗼𝘃𝗲𝗿 𝗺𝗼𝗻𝘁𝗵 𝘄𝗶𝘁𝗵 𝗔𝗽𝗿𝗶𝗹 𝟮𝟬𝟮𝟰:

◼️ Toronto detached home values flat month over month, however with a 4.5% decrease from last year – contributed by the uptick in activity in May 2023. All other home categories in Toronto flat month over month.

◼️ Interesting activity in Mississauga for detached homes as the average price was up almost $100,000 from March to April, and back down $100,000 for May with the average price just over $1.5m. This could be contributed to a greater amount of supply within the past month equating to more buying power. All other home categories in Mississauga were flat month over month. A considerable decrease however, year over year for semi detached homes and freehold townhouses, down 9.5% and almost 13% respectively.

◼️ Oakville detached home values had been trending upwards over the past 2-3 months, however May’s figures brought the average price down by almost $130,000 over the month prior. This may be contributed by fewer homes sold in May in the higher price point category due to affordability as Oakville remains one of the most expensive areas to live in the GTA, and Canada. All other home categories were flat month over month. Big drop in the average home price year/year for condo townhouses, down almost 14%.

◼️ Burlington is the only area in our report that either held with the average price flat or with an increase month over month. Detached home values were flat to April, and up over last year – again, the anomaly compared to other areas. Semi detached home values up $100,000 month over month, freehold townhouses up approximately $80,000. Condo towns and apartments flat, the latter down 11.5% over last year.

𝗪𝗮𝗻𝘁 𝘁𝗼 𝗸𝗻𝗼𝘄 𝘄𝗵𝗮𝘁’𝘀 𝗵𝗮𝗽𝗽𝗲𝗻𝗶𝗻𝗴 𝗶𝗻 𝘆𝗼𝘂𝗿 𝗻𝗲𝗶𝗴𝗵𝗯𝗼𝘂𝗿𝗵𝗼𝗼𝗱? Obtain a personalized market analysis by booking a complimentary Buyer or Seller consultation with us via the form below.