📣 𝐍𝐄𝐖𝐒𝐅𝐋𝐀𝐒𝐇! Here are the real estate market stats you need to know for October 2026 home sales in Toronto, Mississauga, Oakville and Burlington.
October brought an increase in the number of homes sold across the Greater Toronto Area, although market conditions continued to vary considerably by location and property type.
On a broader market level, GTA REALTORS® reported 5,603 homes sold through TRREB’s MLS® System in October 2026, down 7.9% compared to October 2025. New listings declined by 11.9% year over year to 14,173, while the average GTA selling price was $1,024,108, down 2.7% compared to last year.
Looking at the month-over-month activity, the number of homes sold increased by approximately 11% compared to September, while new listings declined by 14%. This is an interesting development worth watching. If the number of homes sold continues to increase while fewer properties enter the market, available inventory could gradually tighten, potentially shifting conditions toward a more balanced market. For now, buyers continue to benefit from considerable choice, with 4.6 months of inventory across the broader GTA.
A closer look at Toronto, Mississauga, Oakville and Burlington reveals a more varied picture, with some housing segments experiencing meaningful price increases while others recorded substantial declines.
Here are our key takeaways on the month-over-month activity between September and October 2026:
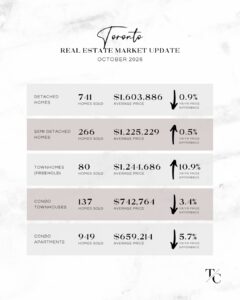
TORONTO REAL ESTATE MARKET – OCTOBER 2026
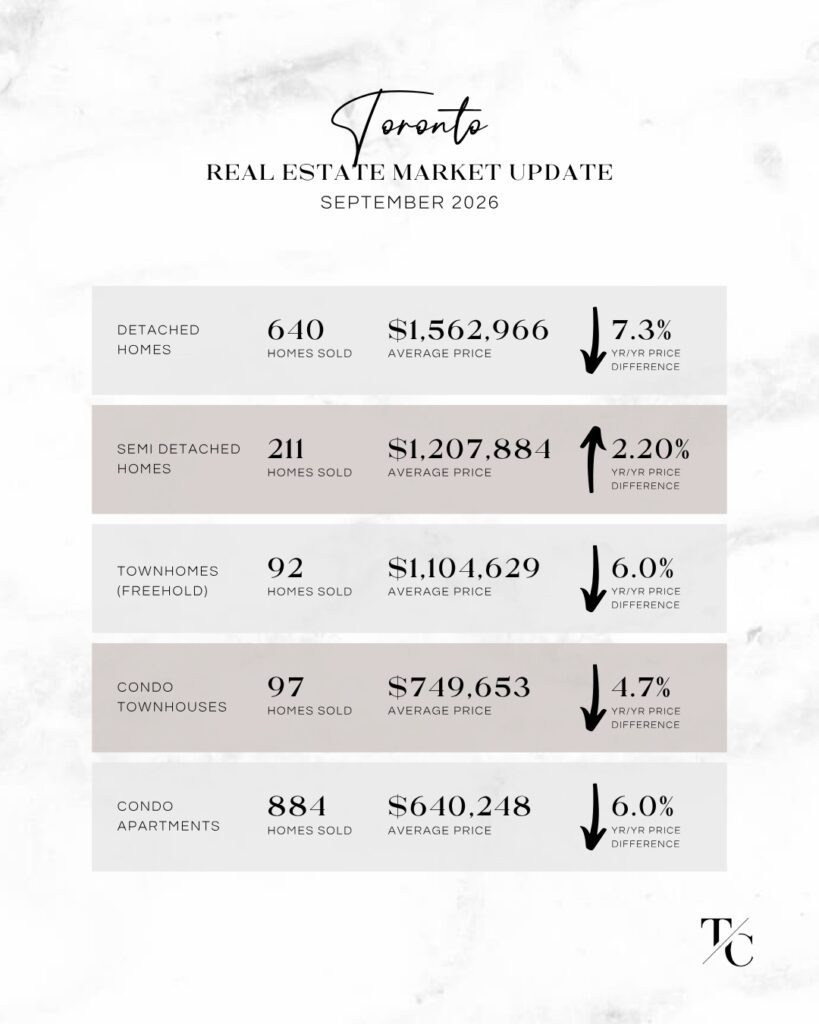
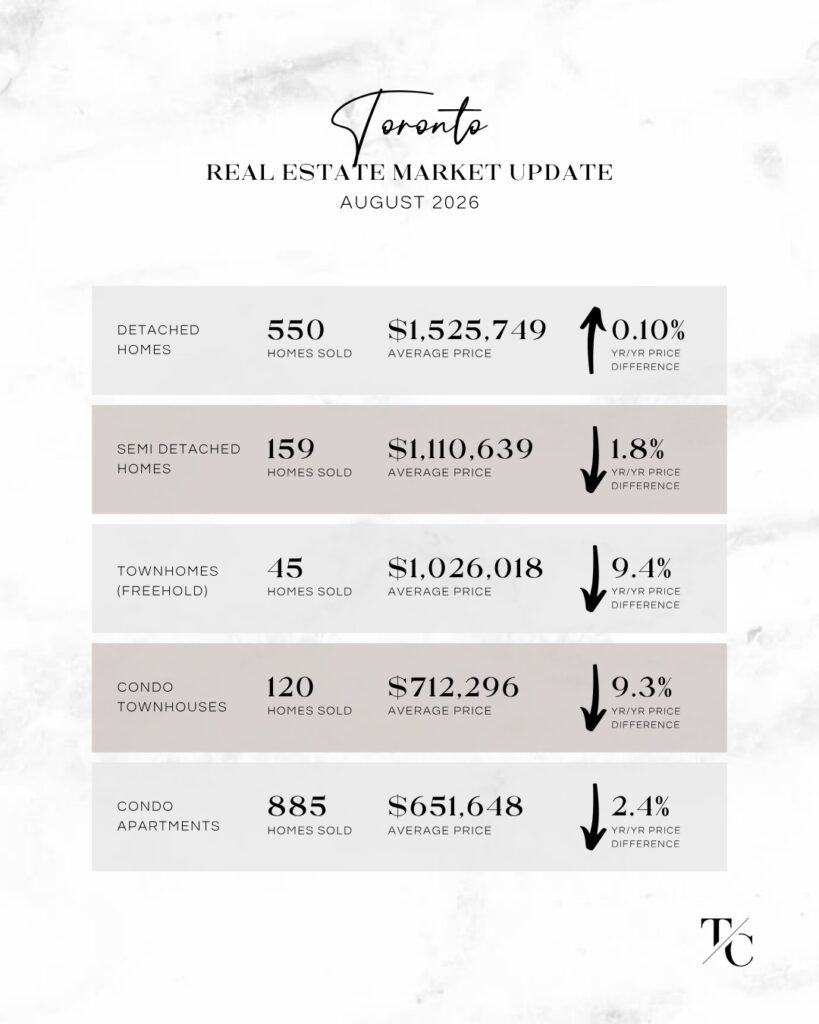
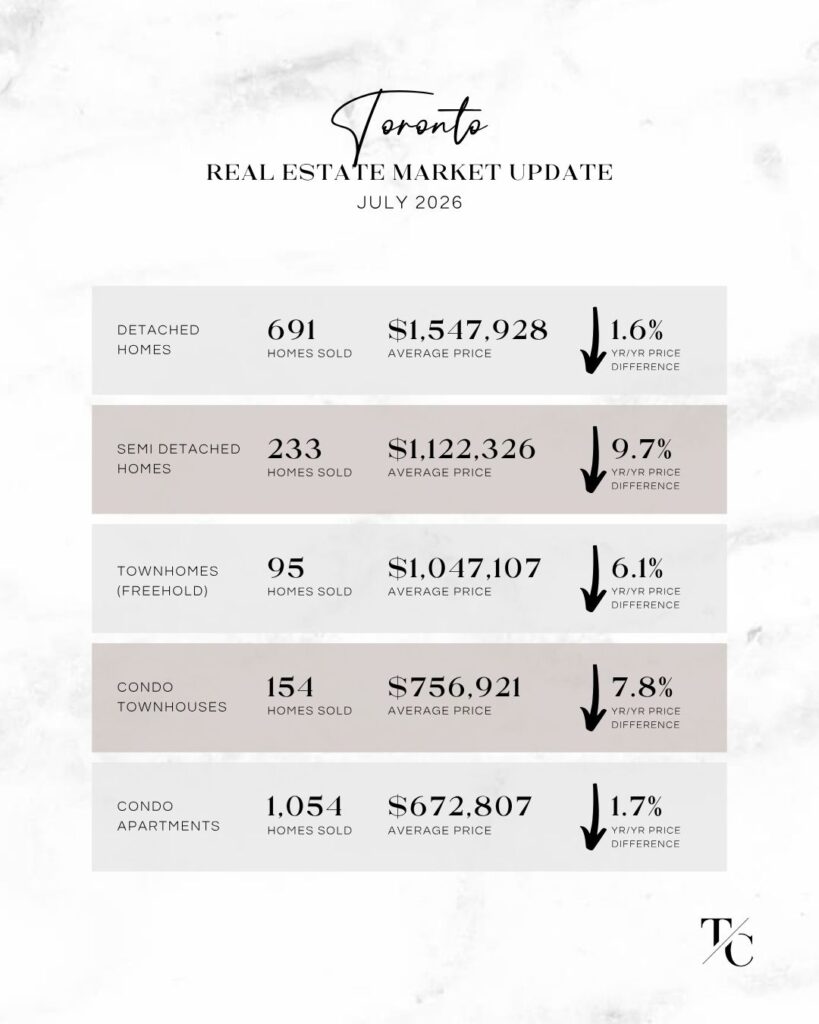
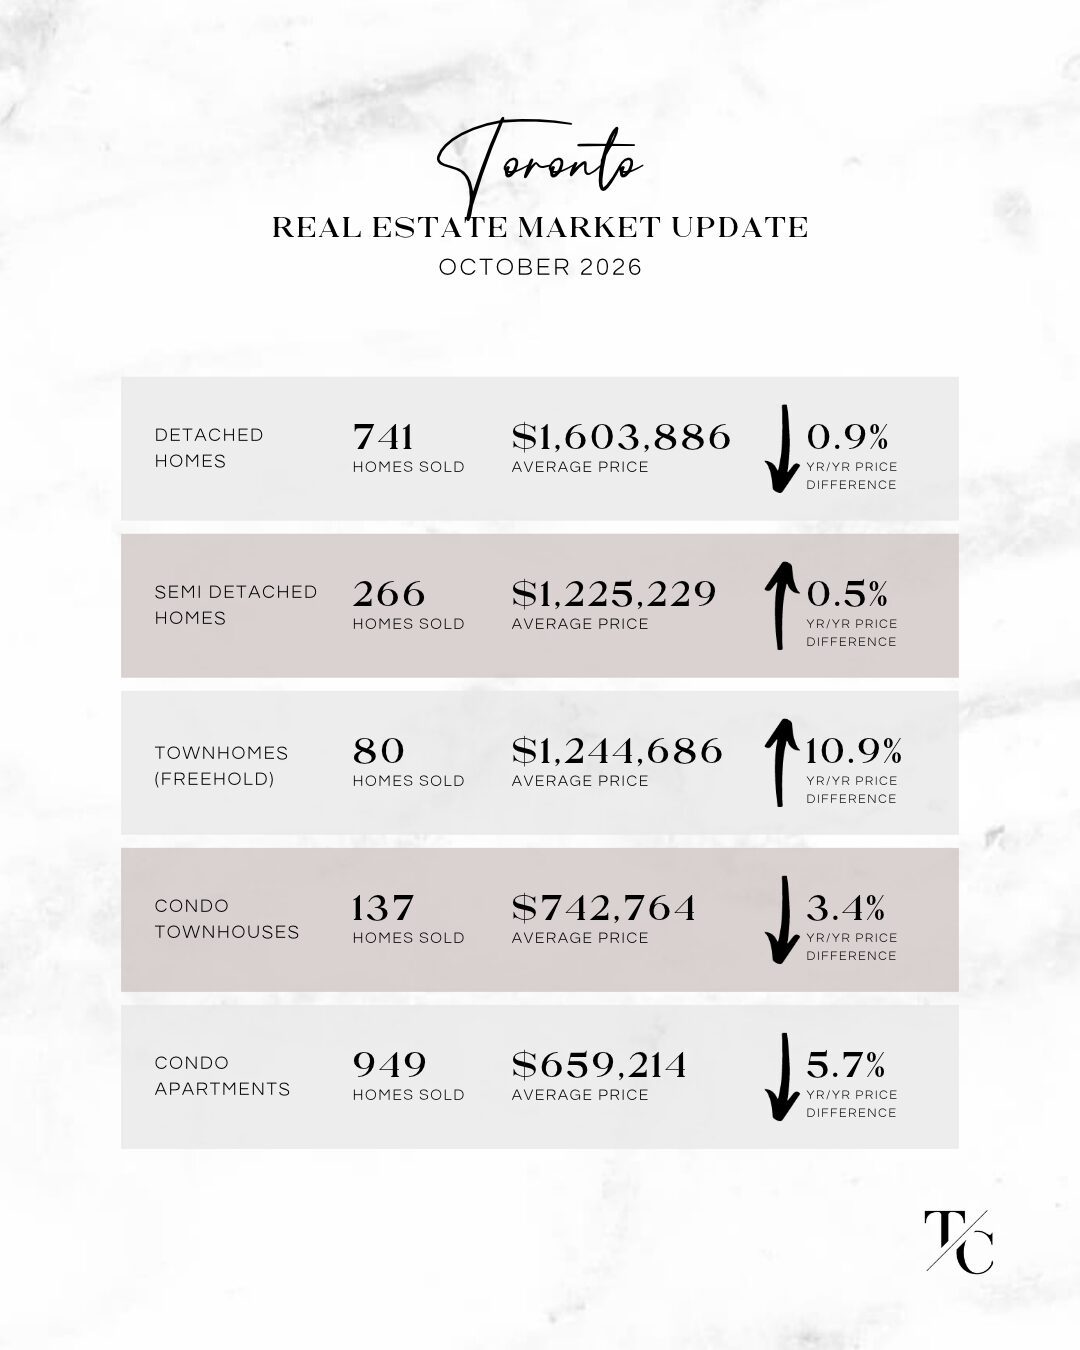
Toronto experienced an increase in the number of homes sold across several housing types in October, along with some notable price gains. The average detached home price increased by approximately $41,000 month over month, while the number of detached homes sold rose by nearly 16%. Semi-detached prices saw a more modest increase of approximately $17,000, with sales also rising by 26%.
Freehold townhouses experienced the largest price increase, with the average price jumping approximately $140,000, or 12.7%, compared to September. Interestingly, the number of homes sold declined by 13% in this segment. Condo townhouse prices remained relatively stable, down approximately $7,000, while sales increased by an impressive 41%. Condo apartments also saw an increase, with the average price up approximately $19,000 and the number of units sold rising by 7%. Year over year, Toronto freehold townhouse prices were up 10.9%, making this another significant change worth noting.
Overall, the increase in the number of homes sold across several housing types is worth watching. If new listings fail to keep pace with demand, available inventory could gradually decline, creating more competition among buyers and upward pressure on prices in certain segments. This could eventually shift conditions in favour of sellers, particularly for property types where supply becomes more limited.
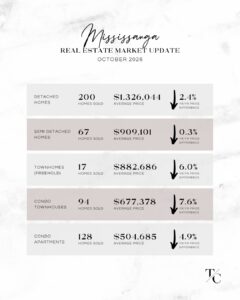
MISSISSAUGA REAL ESTATE MARKET – OCTOBER 2026
Mississauga experienced mixed price movement in October, with detached and semi-detached homes recording increases while townhouse prices declined. The average detached home price increased by approximately $41,000 month over month, with the number of homes sold remaining fairly consistent. Semi-detached prices were up approximately $39,000, although sales declined slightly compared to September.
Freehold townhouses saw the most significant price decline, with the average price dropping approximately $97,000, or nearly 10%, month over month. The number of homes sold, however, increased from 13 to 17. Condo townhouses also experienced a decline, with the average price down approximately $40,000, while the number of homes sold jumped by 54%. This represents a substantial increase in buyer activity within the condo townhouse market, despite lower average prices. Condo apartment prices remained essentially flat, with little change in the number of units sold.
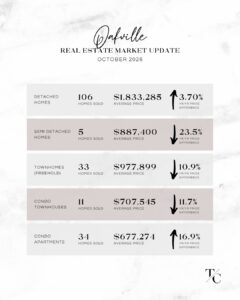
OAKVILLE REAL ESTATE MARKET – OCTOBER 2026
Oakville experienced some of the most significant price movements in October, with several housing segments recording substantial declines. The average detached home price increased by approximately $93,000 month over month, while the number of detached homes sold rose by nearly 25%. This represents a meaningful increase in detached home sales compared to September, suggesting stronger buyer activity in this segment. Semi-detached homes, however, saw a significant price decline of approximately $163,000, with only five transactions recorded in October.
Freehold townhouses were also down considerably, with the average price declining by approximately $189,000 compared to September, despite the number of homes sold increasing by 22%. Condo townhouses experienced an even greater change, with the average price dropping approximately $302,000, or nearly 30%, month over month. This substantial shift suggests that the condo townhouses sold in September may have included more properties at higher price points compared to those sold in October. With just 11 condo townhouse sales in October compared to 13 in September, the mix of properties sold can have a considerable influence on the monthly average.
Condo apartment prices were down approximately $22,000, while the number of units sold increased by 17%. One noteworthy year-over-year change was in Oakville’s condo apartment market, where the average price increased by 16.9% compared to October 2025.
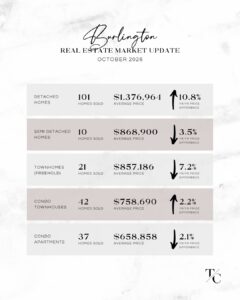
BURLINGTON REAL ESTATE MARKET – OCTOBER 2026
Burlington saw some encouraging price movement in October, particularly across the townhouse and condo apartment markets. The average detached home price increased modestly by approximately $13,000 month over month, while the number of detached homes sold rose by 20%. Year over year, detached prices were also up a notable 10.8%.
Semi-detached prices declined by approximately $24,000 compared to September, while freehold townhouses saw an increase of approximately $34,000, with sales also picking up. Condo townhouses followed a similar trend, with the average price increasing approximately $43,000, or nearly 6%, month over month, while the number of homes sold remained relatively consistent.
Condo apartments also saw an increase, with the average price up approximately $23,000 compared to September. Sales improved considerably in this segment, increasing from 24 to 37 transactions, or approximately 54%. Despite these monthly gains, average condo apartment prices remained slightly below October 2025 levels.
Another important indicator worth highlighting is Burlington’s current inventory level. At just 3.6 months of inventory, Burlington has the lowest supply relative to the pace of sales among the four markets covered in this report. For comparison, Toronto has 4.6 months of inventory, while Mississauga and Oakville each have 4.9 months. This suggests that Burlington’s market is comparatively tighter, with fewer homes available relative to buyer activity. If this trend continues, it could lead to increased competition for well-priced properties and provide sellers with a stronger negotiating position.
Want to know what’s happening in your neighbourhood?
Obtain a personalized market analysis by booking a complimentary Buyer or Seller consultation via the form below.