📣 𝐍𝐄𝐖𝐒𝐅𝐋𝐀𝐒𝐇! Here are the real estate market stats you need to know for August 2026 home sales in Toronto, Mississauga, Oakville and Burlington.
August brought a noticeable slowdown in sales volume across many of the housing segments we track, while average home prices were more varied depending on location and property type. Several segments remained relatively stable month over month, while others experienced more significant price movement.
On a broader market level, GTA REALTORS® reported 5,057 home sales through TRREB’s MLS® System in August 2026, down 2.1% compared to August 2025. New listings declined more significantly, down 14.1% year over year to 12,075. The average GTA selling price was $993,410, down 2.7% compared to August 2025. On a seasonally adjusted basis, home sales edged slightly lower compared to July, while the average selling price increased slightly month over month.
The decline in new listings is worth watching as we move toward the fall market. While buyer activity moderated in August, fewer new listings coming to market can also reduce choice for buyers. Market conditions continue to vary considerably depending on location and property type, making the most recent local data particularly important when assessing current conditions.
Here are our key takeaways on the month-over-month activity between July 2026 and August 2026:
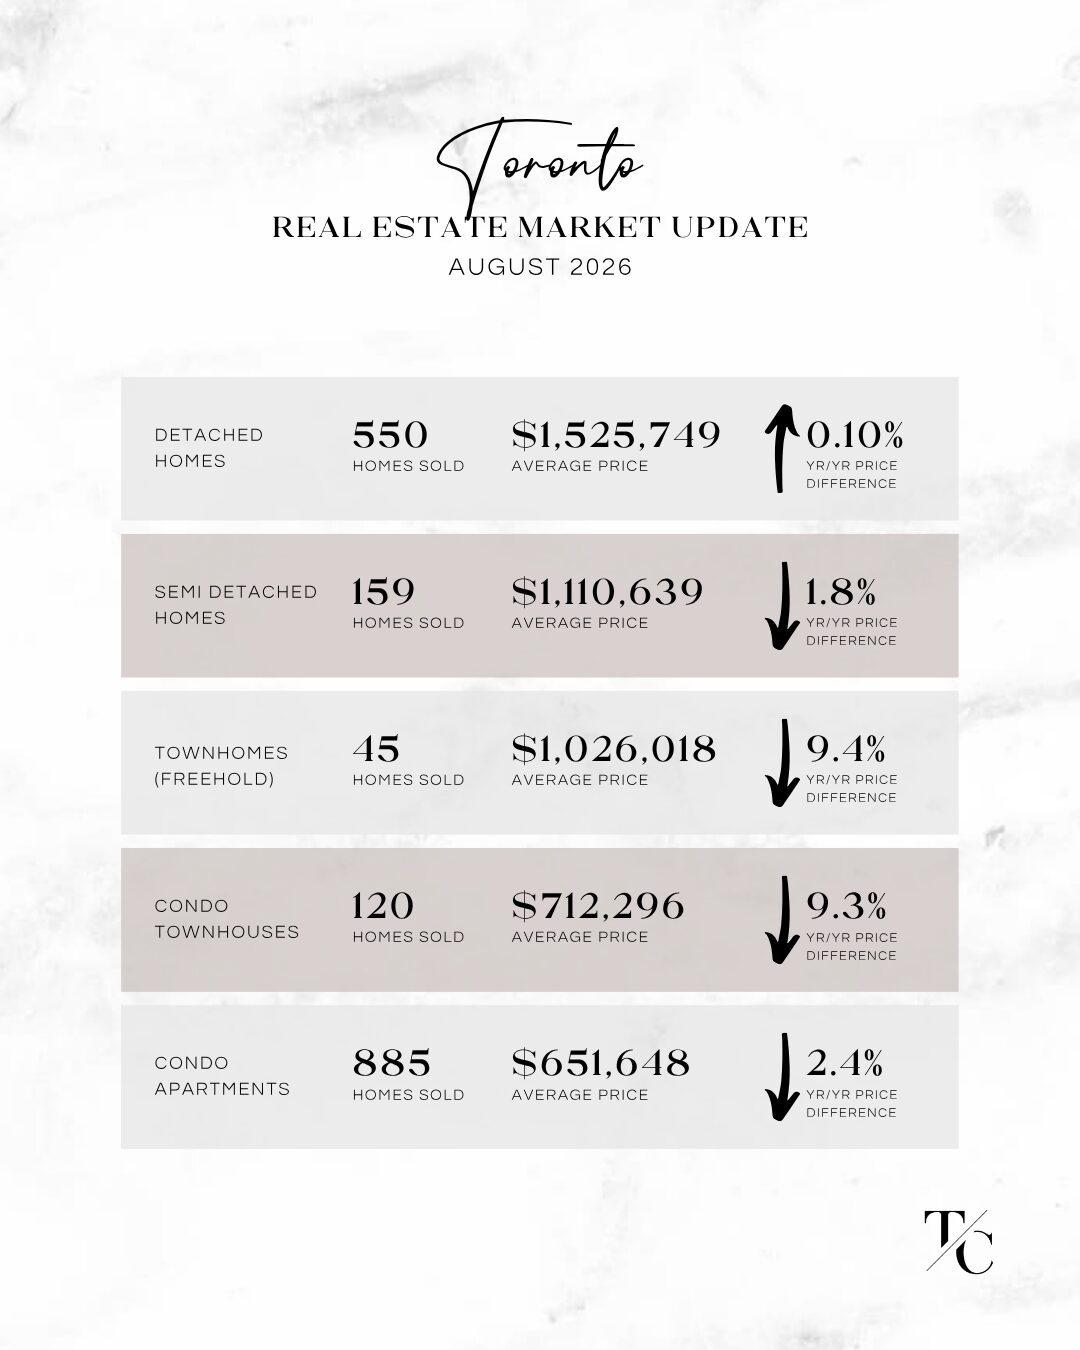
TORONTO REAL ESTATE MARKET – AUGUST 2026
Toronto average home prices were fairly consistent across most housing types in August, with no significant month-over-month price change in the detached, semi-detached or freehold townhouse markets. Where we saw a greater shift was in sales volume (the number of homes sold). Detached home sales volume was down approximately 20% month over month, representing 141 fewer homes sold in August. Condo townhouses saw the largest price decline, with the average price down approximately $45,000 compared to July. Condo apartment prices remained relatively stable, while sales volume was down approximately 16%, representing 169 fewer condo units sold compared to the month prior.
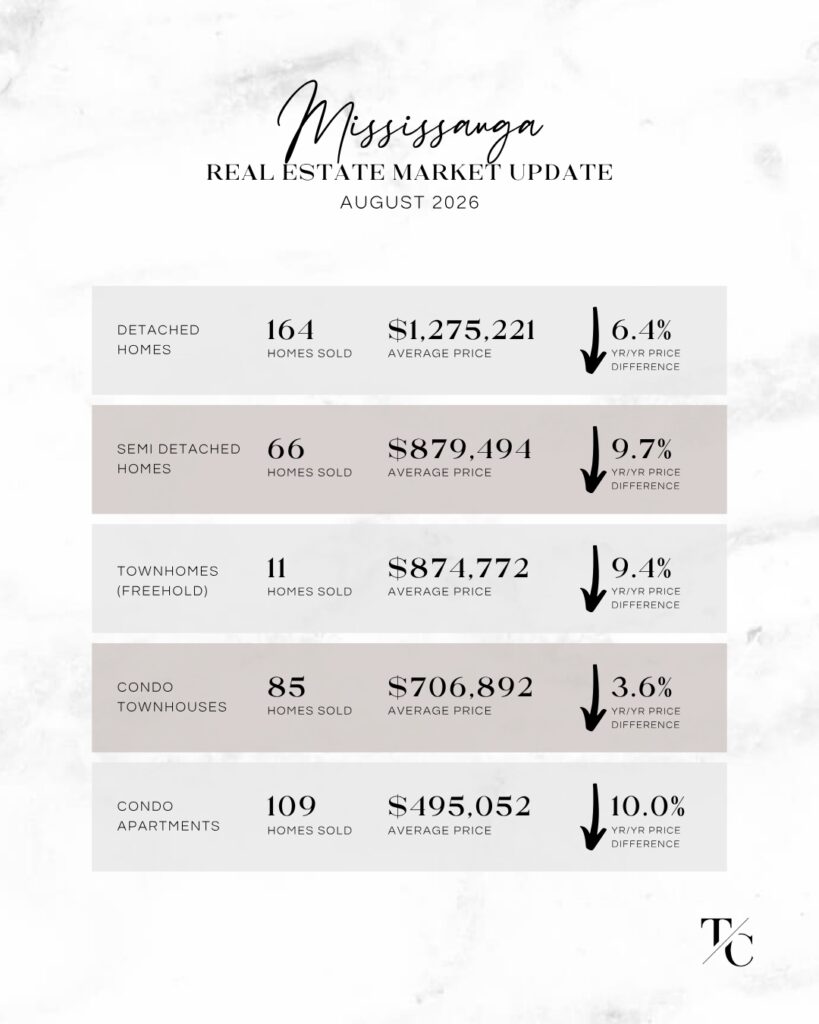
MISSISSAUGA REAL ESTATE MARKET – AUGUST 2026
Mississauga home prices were also fairly consistent across most housing types on a month-over-month basis. The average detached home price was essentially flat, while detached sales volume was down approximately 11%. Semi-detached and condo townhouse prices also saw little change from July. Freehold townhouses experienced the largest price decline, with the average price down approximately $37,000 month over month, while sales volume declined by approximately 52%. Condo apartment prices remained relatively stable compared to July. Year over year, the average condo apartment price was down 10%, making this the most significant annual price change among product type in Mississauga.
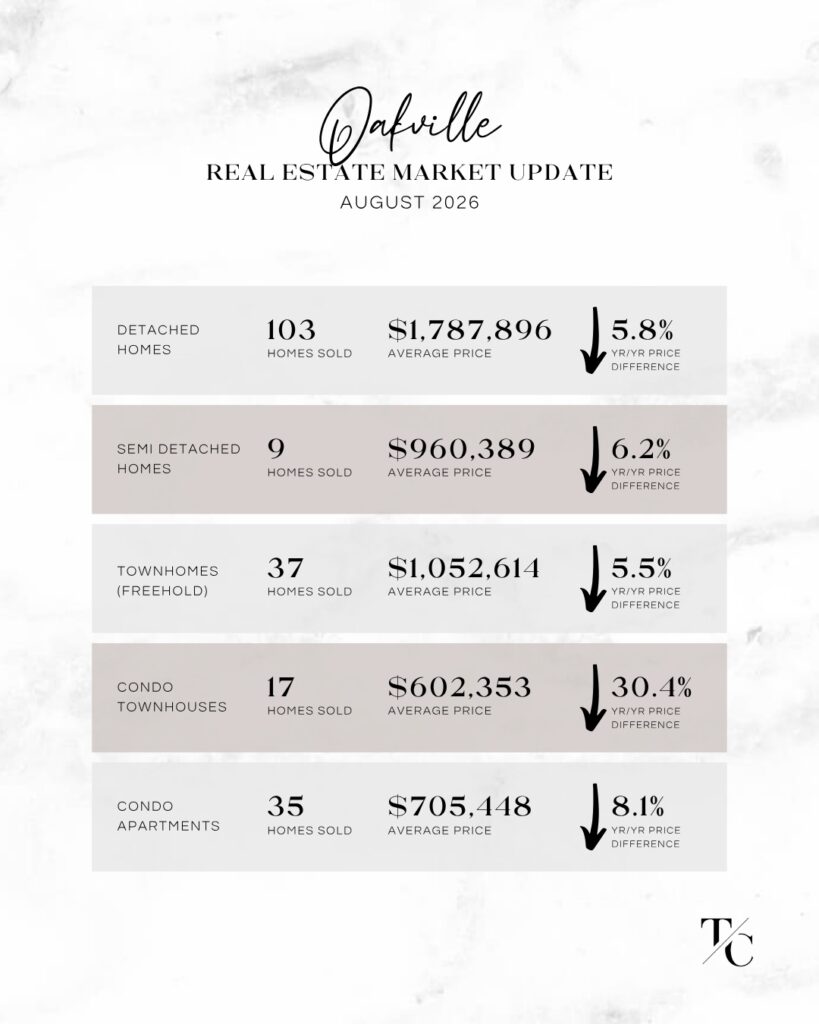
OAKVILLE REAL ESTATE MARKET – AUGUST 2026
Oakville experienced more significant price movement in August, providing greater buying power for purchasers. The average detached home price declined by approximately $116,000 month over month, while detached sales volume was down approximately 24%. The average semi-detached home price was down approximately $125,000, while freehold townhouse prices remained relatively stable compared to July. Condo townhouses were down approximately $65,000 month over month, with an even more significant decline year over year: the average price was down a staggering 30.4%, from $865,624 in August 2025 to $602,353 in August 2026 — a difference of more than $263,000. Good news for Oakville’s condo apartment market: the average price saw a significant increase, up nearly $69,000, or 10.8%, month over month.
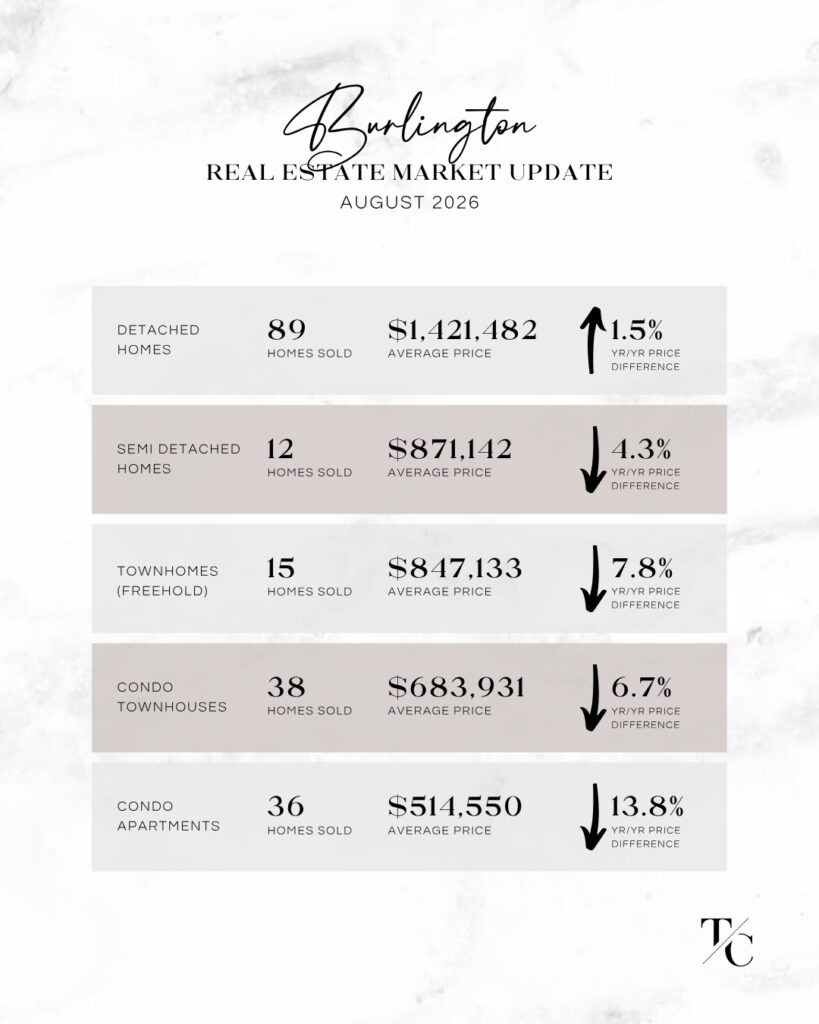
BURLINGTON REAL ESTATE MARKET – AUGUST 2026
Burlington experienced some of the larger month-over-month price movements in August. The average detached home price increased by approximately $72,000, or just over 5%, while detached sales volume was down approximately 21%. Semi-detached prices were essentially flat, while freehold townhouse prices remained relatively stable. Condo townhouses saw a significant decline, with the average price down approximately $94,000, or 12%, month over month, despite sales volume increasing by approximately 27%. Opportunity knocks for Burlington condo buyers, as the average condo apartment price dropped approximately $123,000, or 19%, month over month. Condo apartment sales volume was also down approximately 22%. For context, the average condo apartment price in Burlington was down 13.8% year over year, making this another significant change worth noting.
Want to know what’s happening in your neighbourhood?
Obtain a personalized market analysis by booking a complimentary Buyer or Seller consultation via the form below.
Connect with Us Today
Fill in a few details here and we will be in touch.